Zcash Price Forecast: ZEC rebounds from 200-day EMA, eyeing to reclaim $1,000
- Zcash hovers around $960 on Wednesday, holding steady after a 7% rebound from the 200-day EMA around $876 the previous day.
- Institutional demand remains weak, with zero inflow on Tuesday following over $9 million in outflows on Monday.
- The technical outlook for ZEC indicates a near-term bullish bias as downside momentum wanes.


Zcash (ZEC) holds steady above $960 on Wednesday, showing signs of a potential bullish reversal after a 7% rebound the previous day. Institutional investors remain muted while the derivatives market shows renewed bullish speculation. Technically, Zcash’s rebound from the 200-day Exponential Moving Average (EMA) around $876 must reclaim the 50-day EMA at $1,134 to reinstate an upward trend.
Speculative demand in Zcash futures offsets ETF outflows
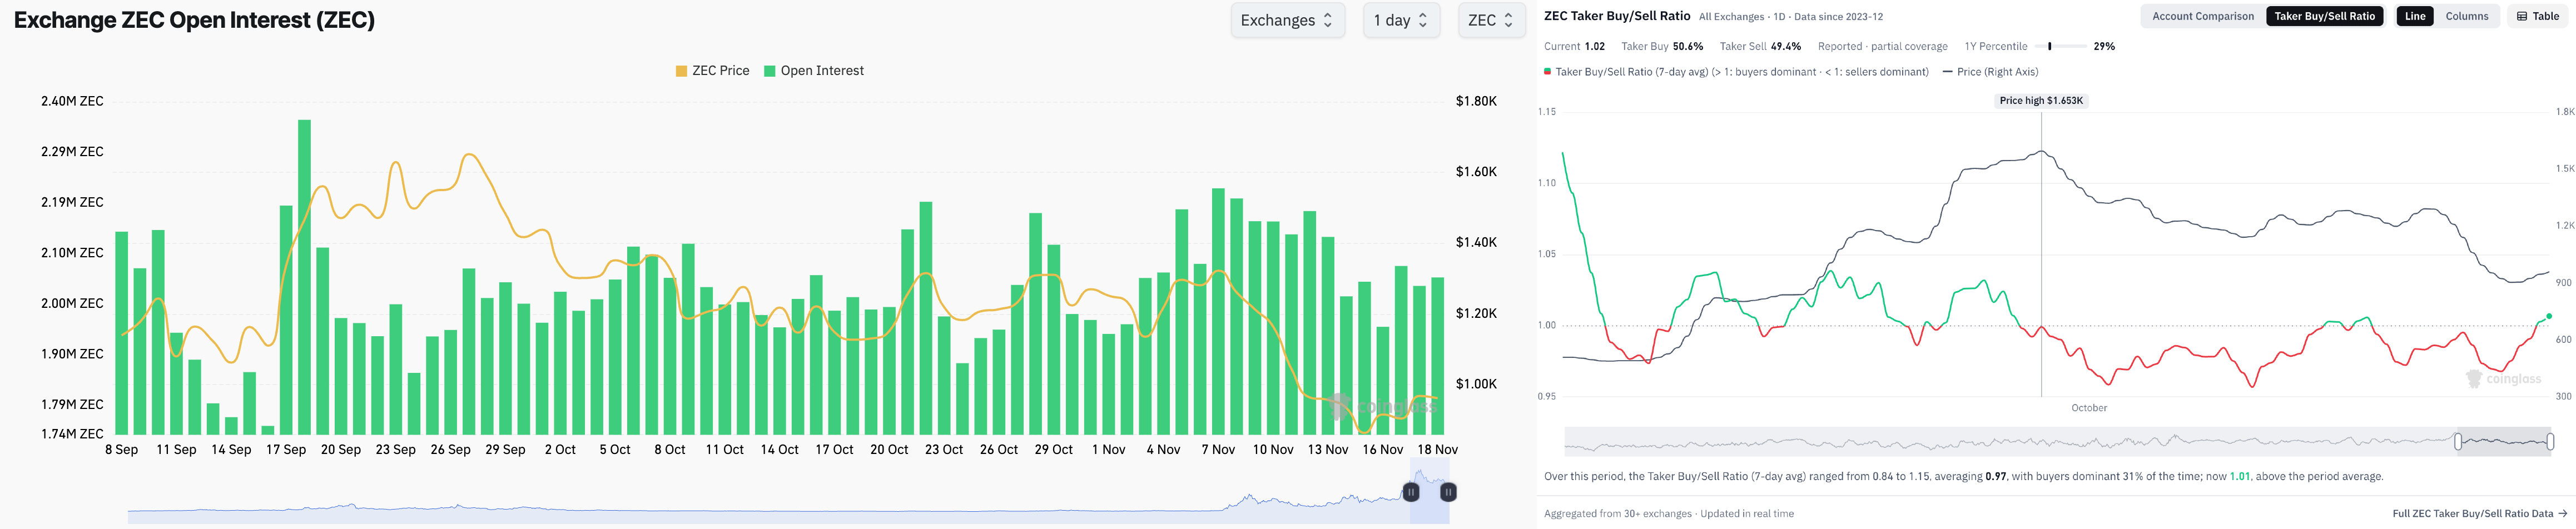
Zcash shows signs of recovery so far this week, with renewed elevated derivatives trading activity. CoinGlass data shows Zcash futures Open Interest (OI) at around 2.05 million ZEC, up from 1.96 million ZEC on Sunday, indicating a fresh buildup in positions this week and suggesting anticipation of further upside.
In addition, Zcash’s taker buy-to-sell ratio rises above 1 on Wednesday, from 0.973 last week, indicating that fresh bids are absorbing sell-side pressure.
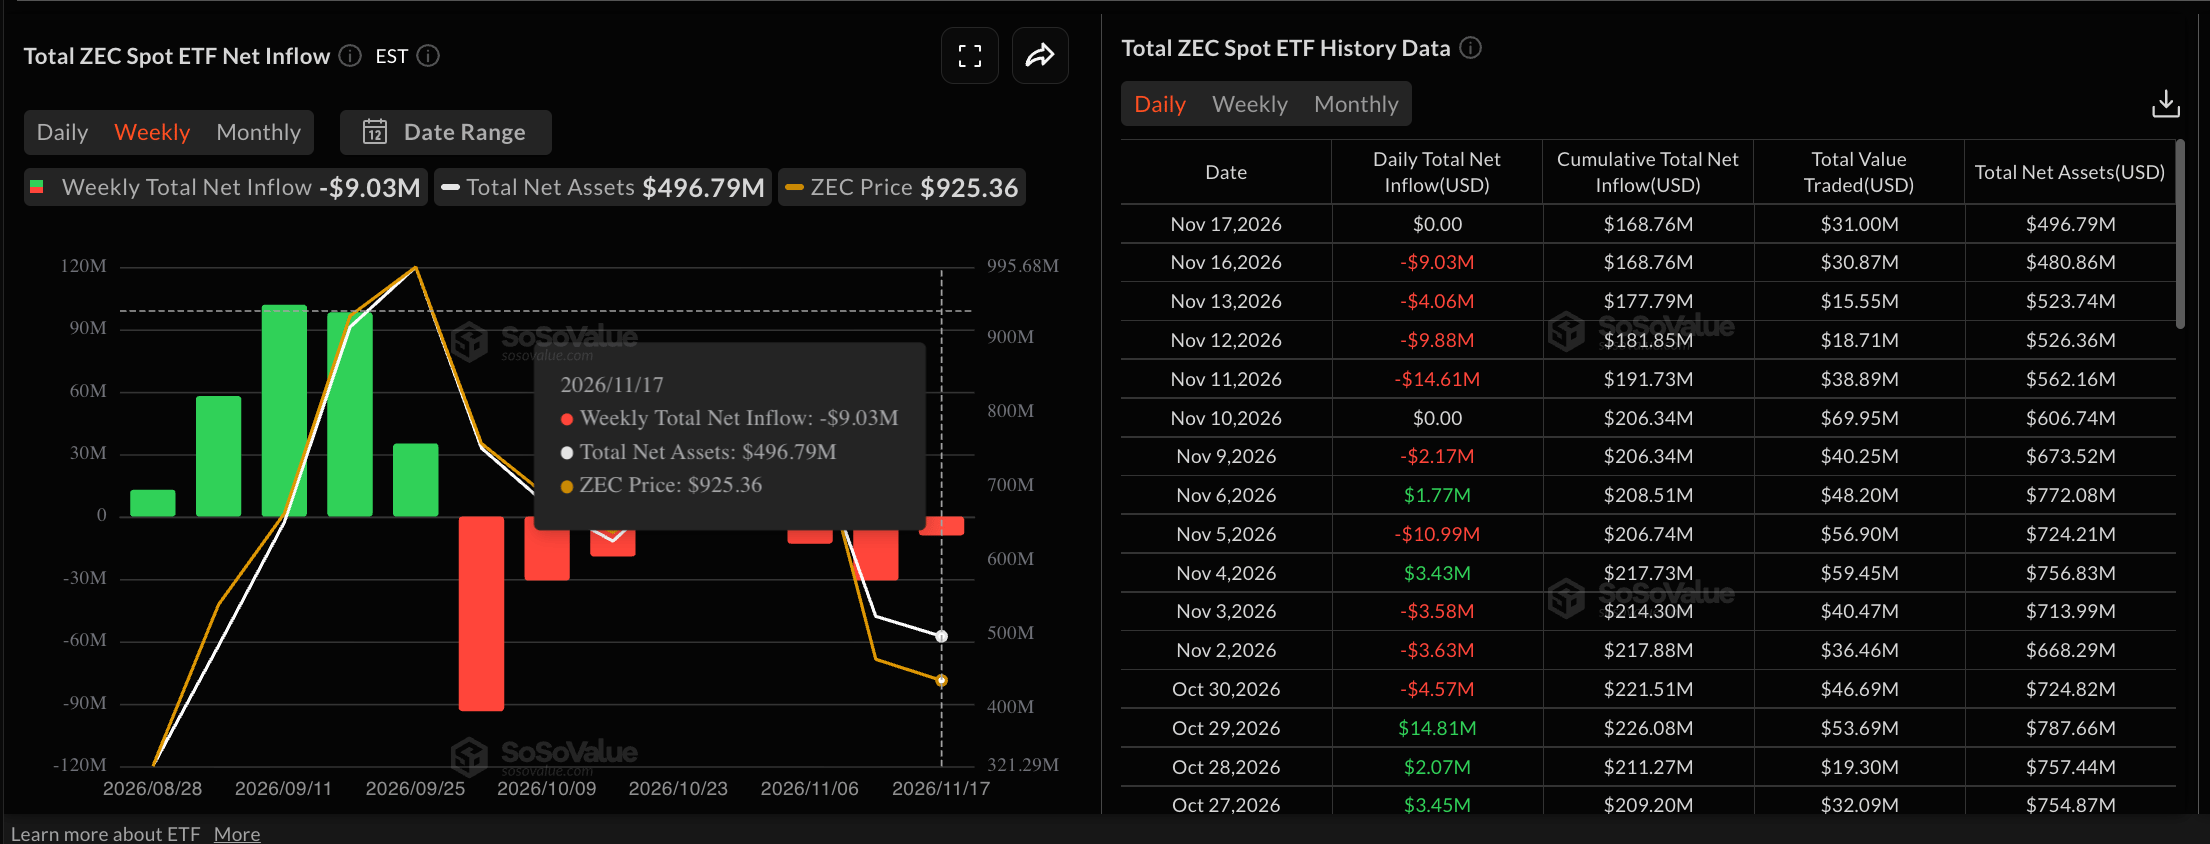
The renewed demand in Zcash derivatives offsets the persistent ETF outflows seen since last week’s total withdrawal of $30 million. SoSoValue data shows the zero inflow on Tuesday, following $9.03 million in outflows on Monday, indicating a net sell-side bias among institutional investors.
Technical outlook: Will Zcash reclaim the $1,000 mark?
Zcash trades at $962, holding the previous day's 7% gains. The privacy coin shows a rebound attempt from the 200-day Exponential Moving Average (EMA) around $876 after the previous week's 24% decline below the 50-day EMA at $1,134.
Downside pressure on the daily chart is evident, with the Moving Average Convergence Divergence (MACD) line in negative territory, while the Relative Strength Index (RSI) is below the midline at around 39. However, the easing MACD histogram profile and the RSI bouncing back from the oversold boundary suggest moderating selling pressure.
On the topside, initial resistance emerges at the horizontal barrier near $1,050, ahead of the more important 50-day EMA at $1,134. A daily close above this cluster would be needed to ease the current bearish tone and open the way toward the distant $1,698 resistance.
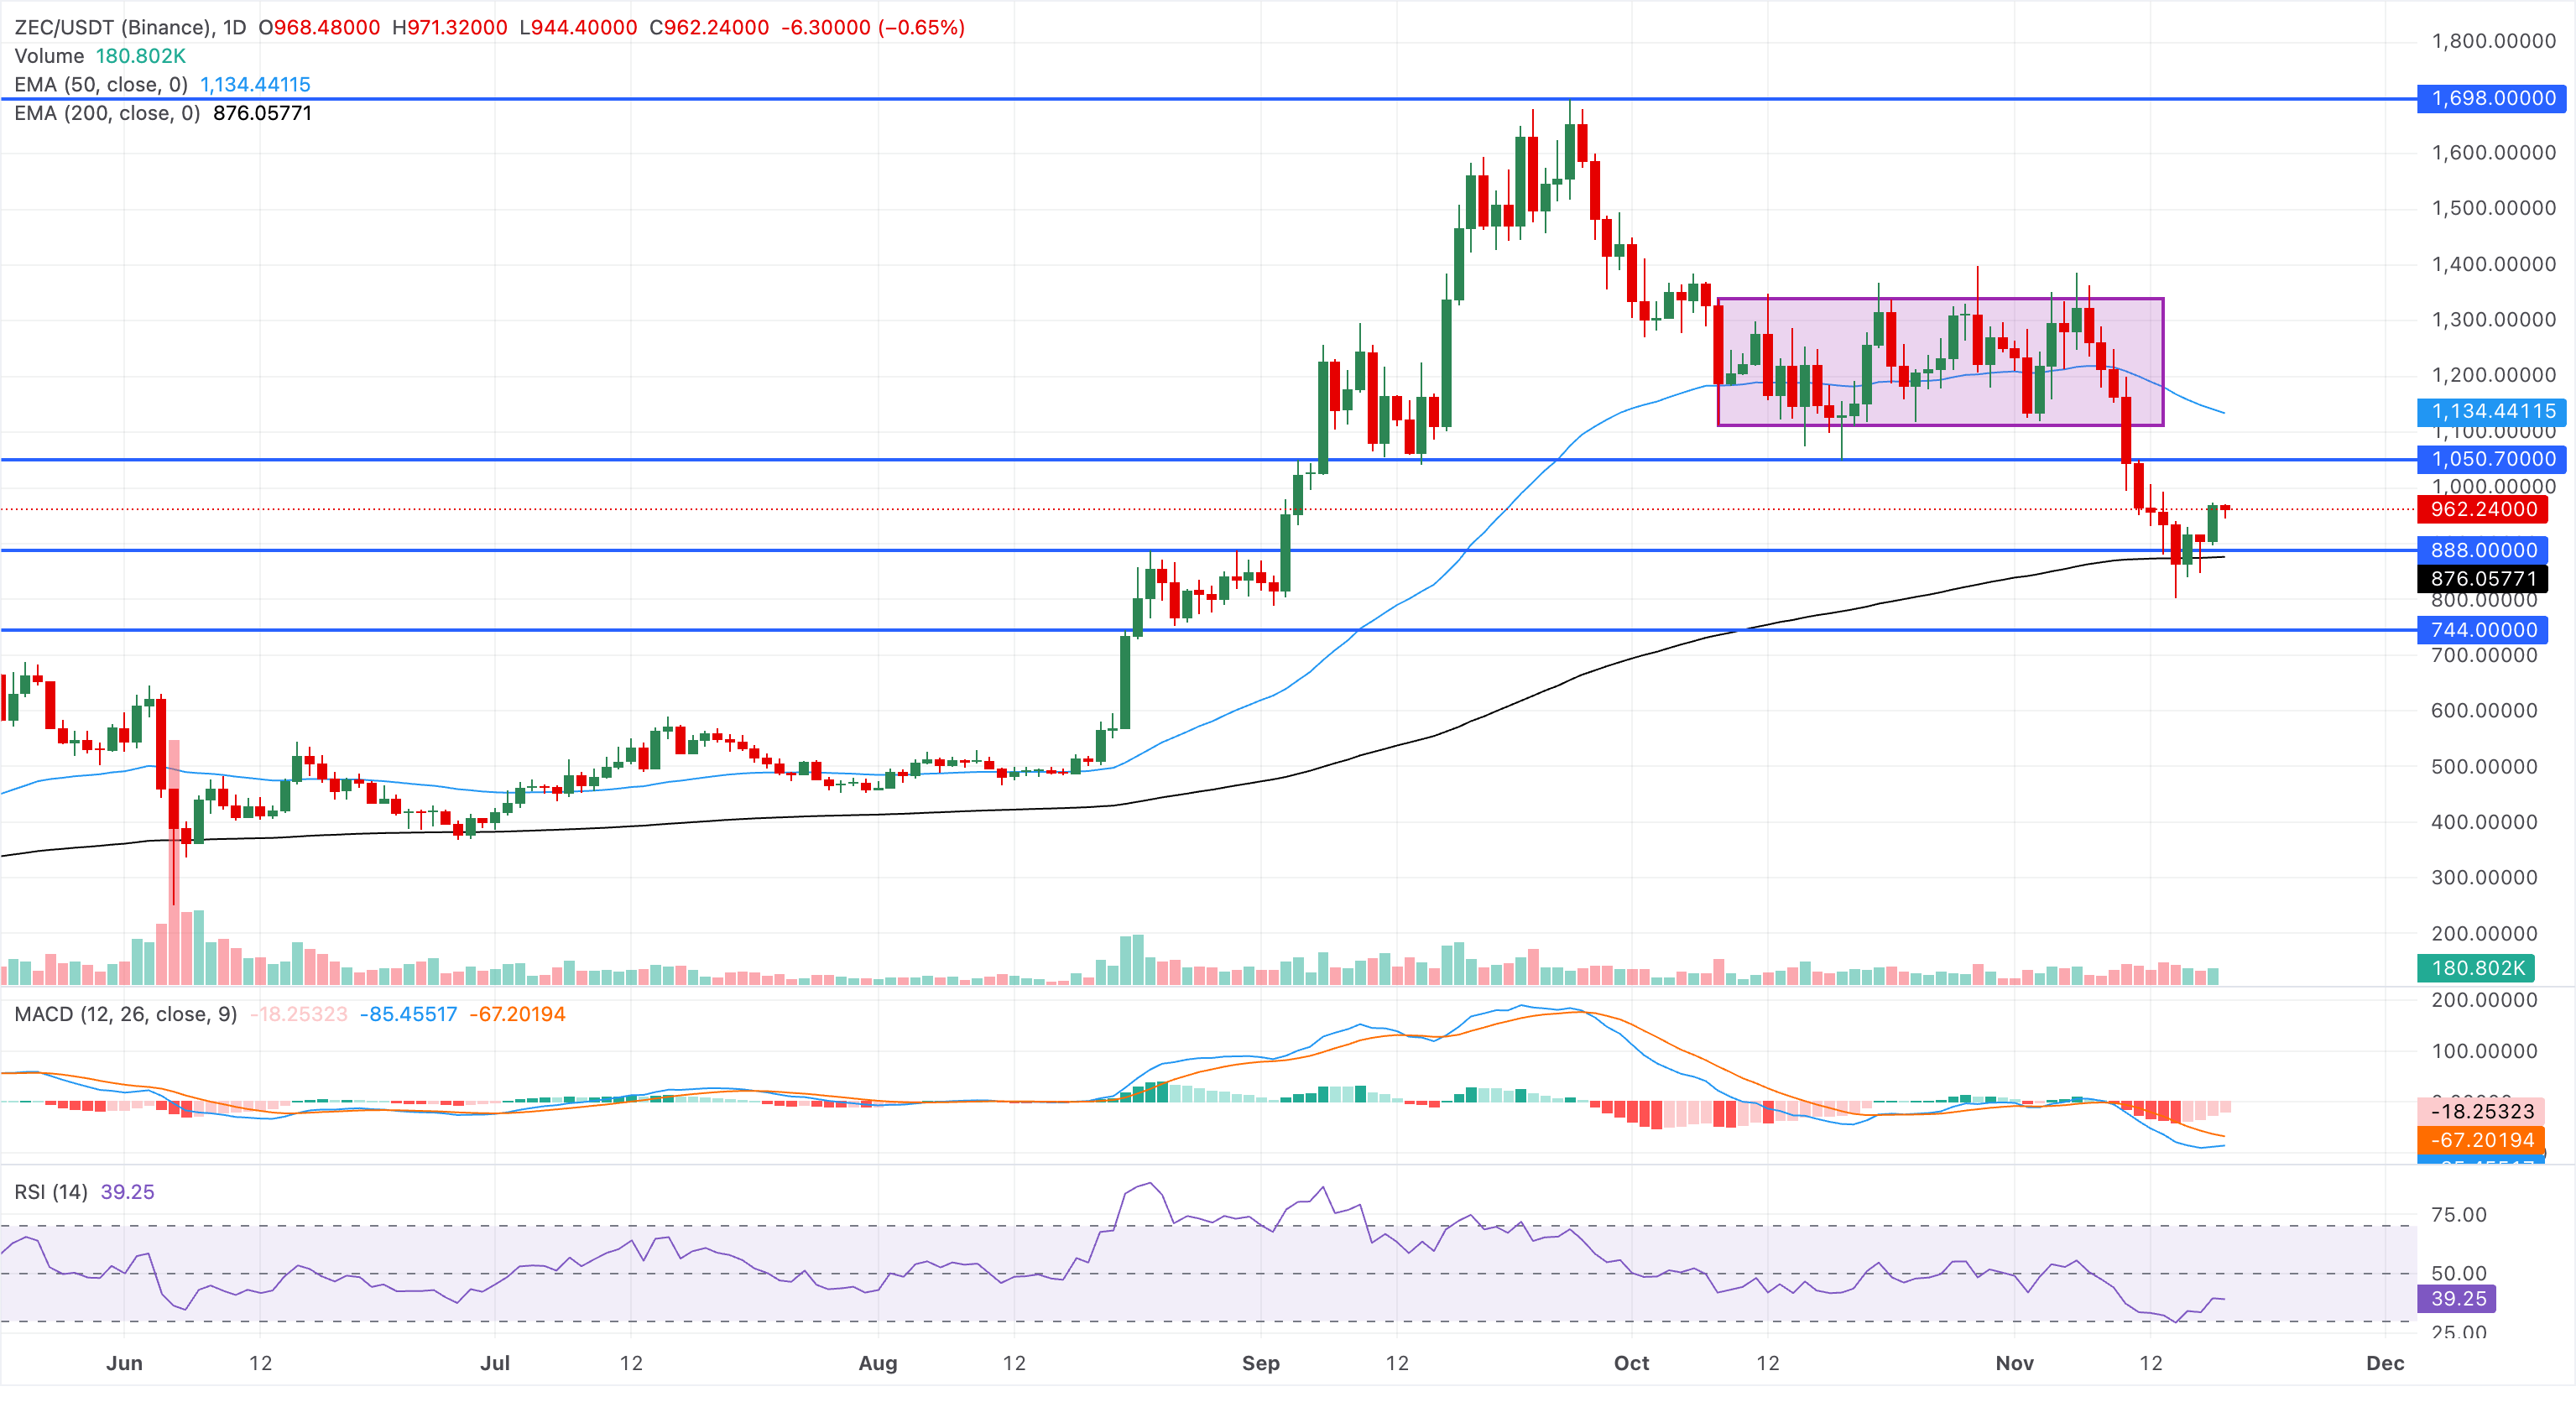
Looking down, immediate support is aligned around the $888 horizontal level and the 200-day EMA at $876, with a break below this demand zone exposing the next key floor at $744 and reinforcing the broader downside risk.
(The technical analysis of this story was written with the help of an AI tool. Know more.)
Author
Vishal Dixit
FXStreet
Vishal Dixit holds a B.Sc. in Chemistry from Wilson College but found his true calling in the world of crypto.