Why smart money is watching $2,050 and $2,150 today: Ethereum's next big move is coming
- Ethereum is consolidating between $2,050 support and $2,150 resistance, awaiting a breakout catalyst.
- The Ethereum Foundation sold 5,000 ETH via OTC, adding short-term selling pressure.
- The upcoming "Glamsterdam" upgrade promises a 78% fee reduction and 10,000 TPS.

On March 15, 2026, Ethereum is trading in a narrow range near $2,100. ETH moves between small gains and small losses during the day. Traders watch the chart closely while the market absorbs recent news and prepares for a network upgrade expected later this year.
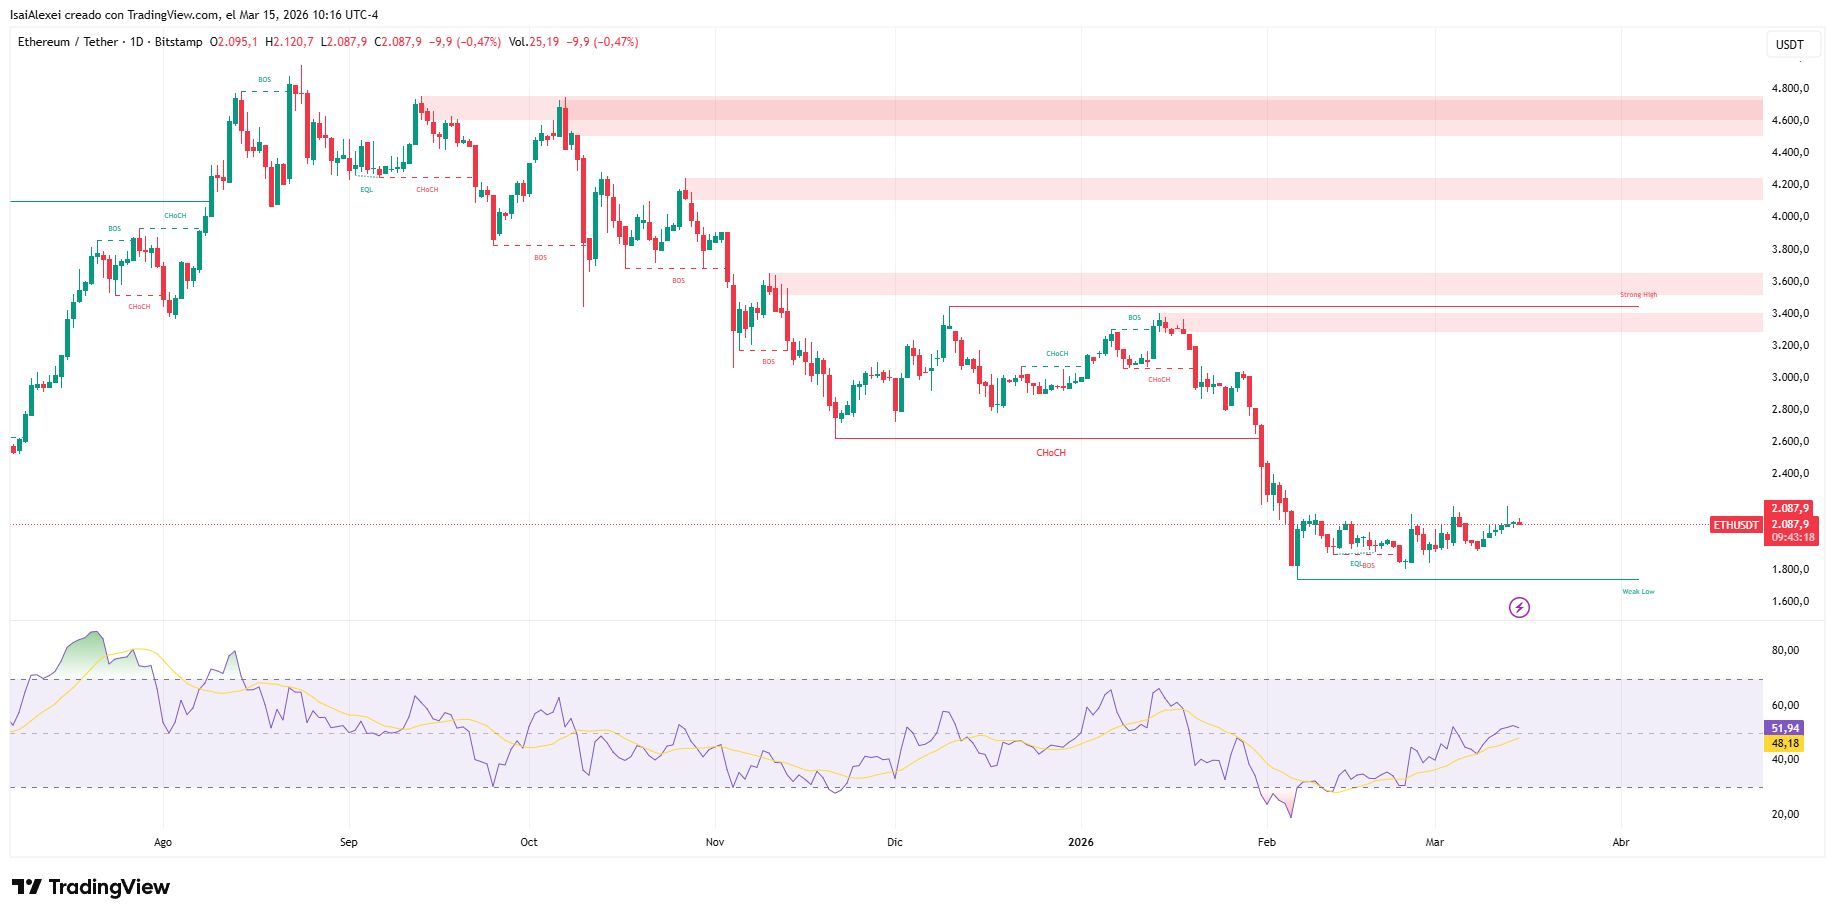
At the time of writing, the price fluctuates between $2,090 and $2,110. This behavior shows a consolidation phase. Buyers try to defend the current area, while sellers attempt to push the price lower. For now, neither side controls the market.
Current technical structure
The first support zone sits between $2,080 and $2,050. This area acts as a cushion for the price. If Ethereum falls below that band, the next level traders watch is $2,000. That level often attracts attention because many orders cluster around round numbers.
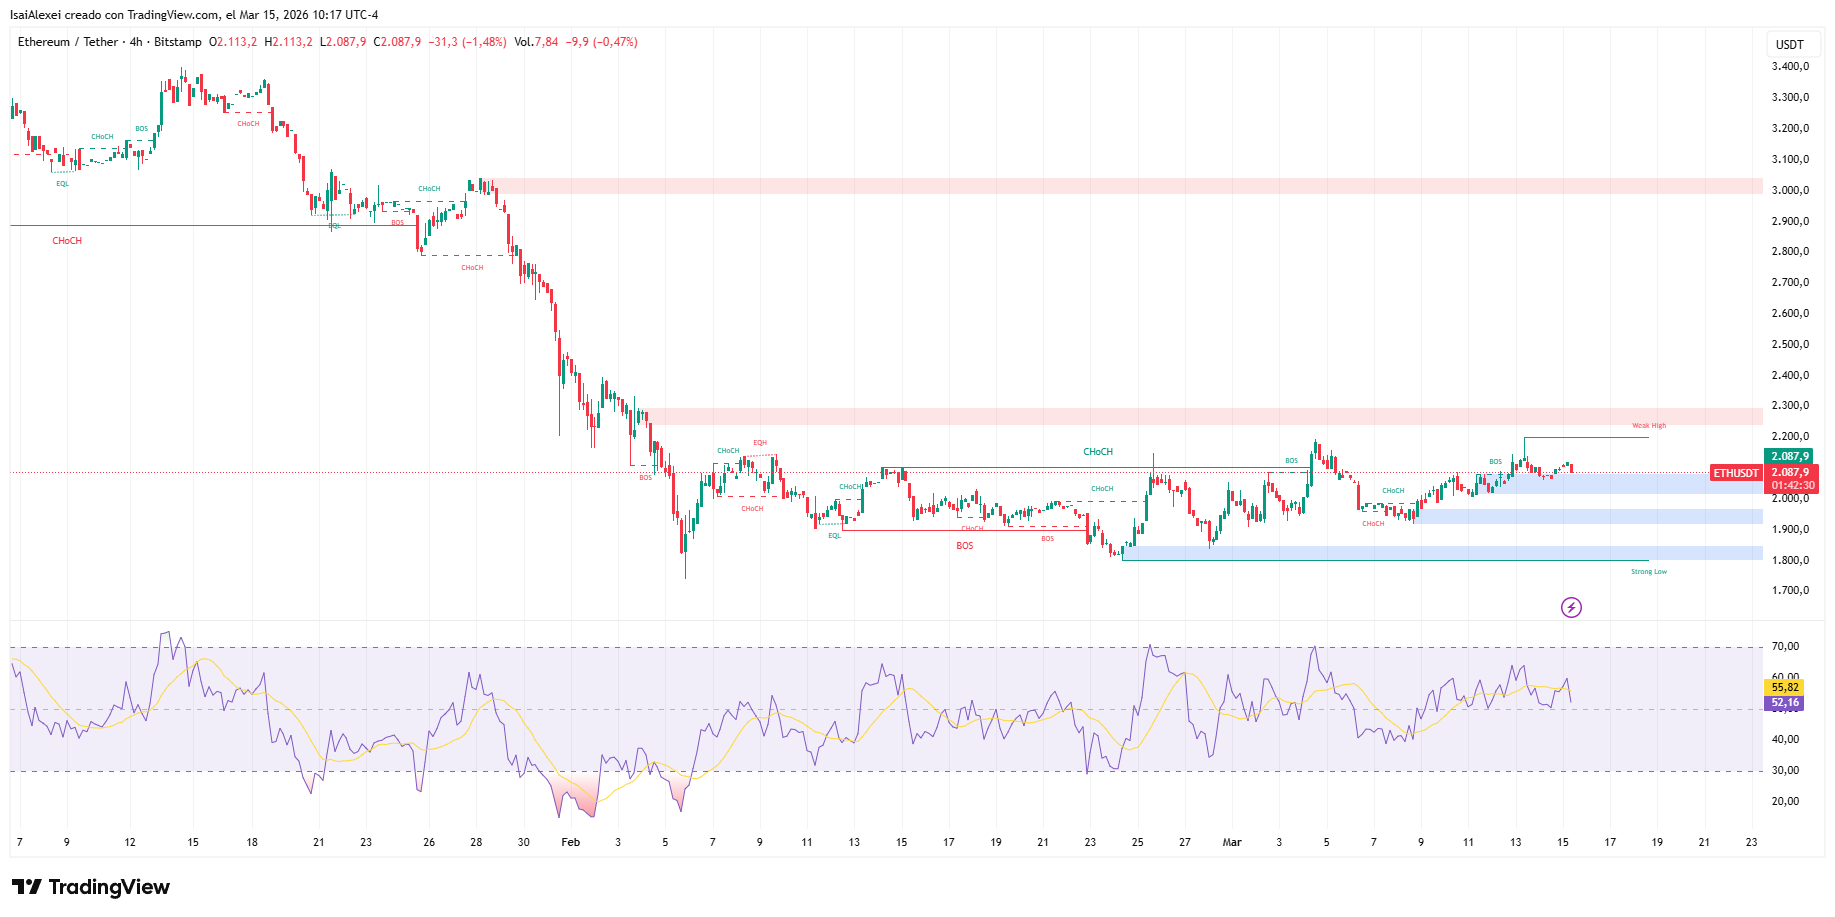
Below $2,000, liquidity appears near $1,940. A break into that area could accelerate selling pressure. In the medium term, analysts track a deeper support zone between $1,820 and $1,800. That region served as a base during previous market reactions.
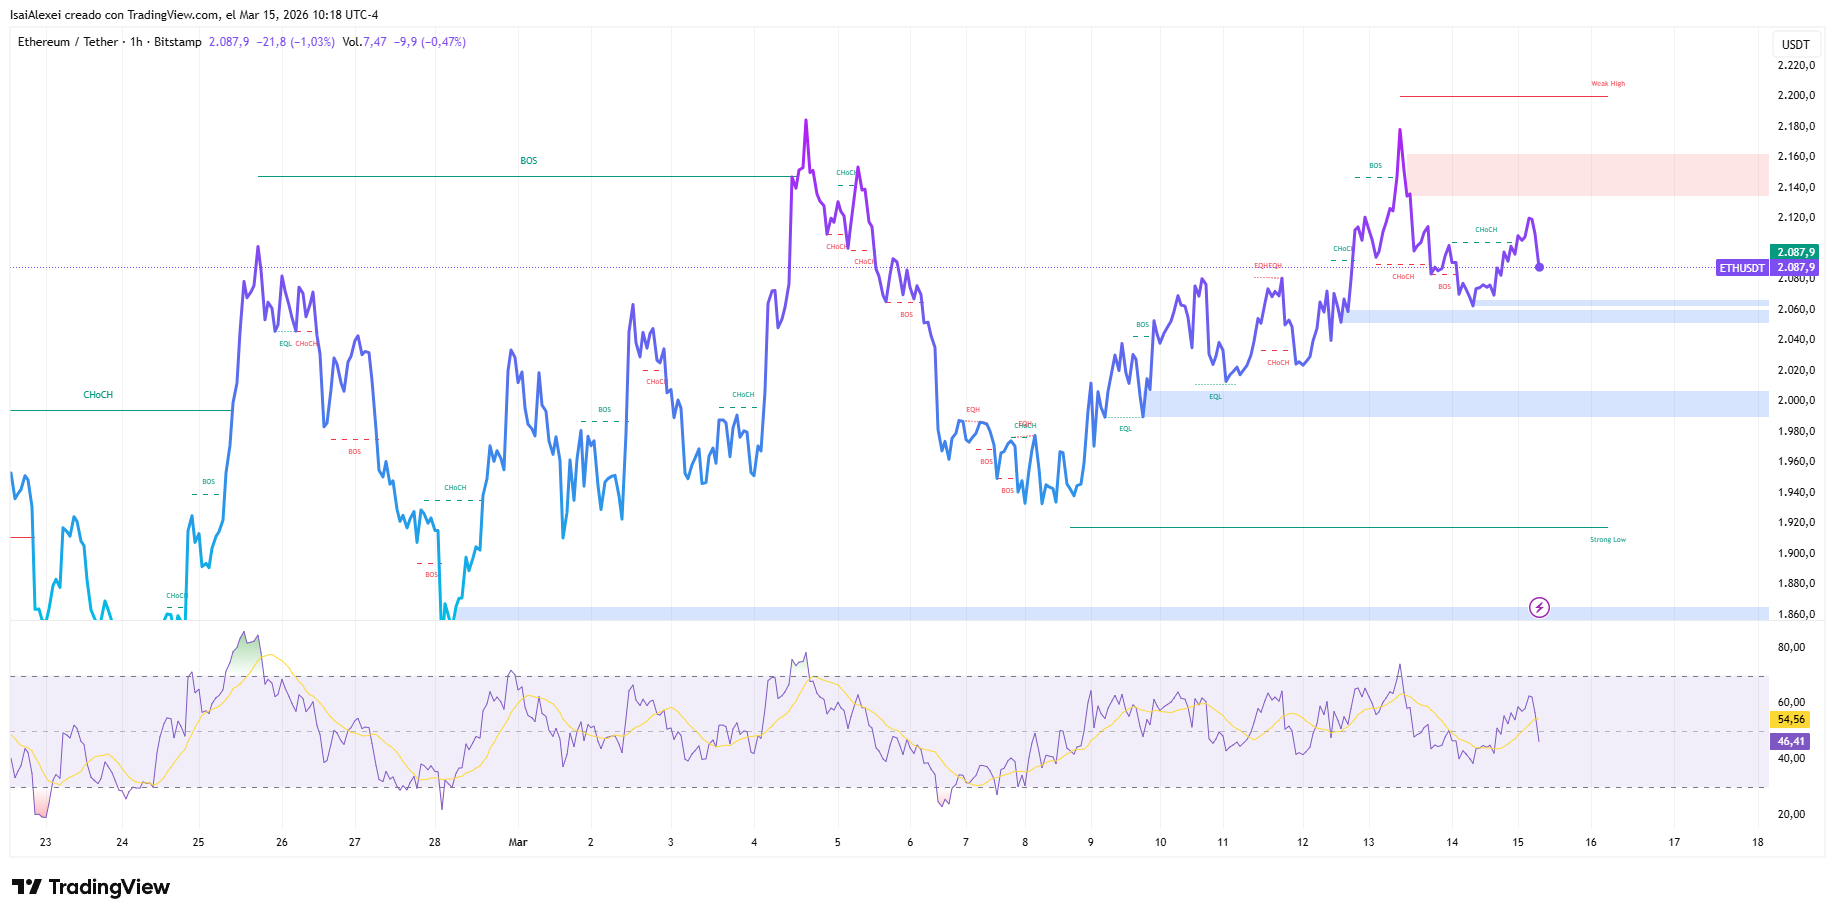
Resistance stands slightly above the current market. The first barrier sits between $2,120 and $2,150. Price has tested that area several times but failed to move through it with strength. If buyers push above that level with clear volume, traders expect the next targets around $2,380 and later near $2,750.
Indicators show a neutral market
Technical indicators confirm the lack of clear direction. The Relative Strength Index remains near 50. This value signals a neutral condition where the asset is neither overbought nor oversold.
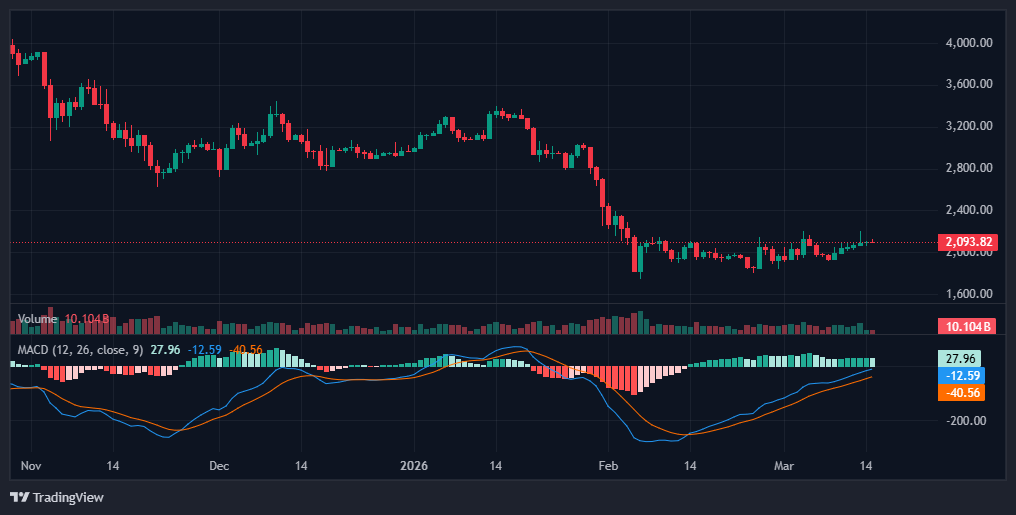
The MACD indicator presents mixed signals. The bearish side still holds a small advantage, yet momentum has started to improve. That shift suggests the market could change direction if buying pressure increases.
Bollinger Bands add another detail to the chart. The price currently touches the upper band, which lies near $2,143. The lower band sits close to $1,859. When price reaches the edge of these bands during low volume conditions, volatility often follows.
Daily chart signals consolidation
The daily timeframe shows a market that still carries traces of a broader downtrend. Ethereum recovered from the recent low around $1,736, yet it now faces a dense resistance wall near $2,140–$2,150. Moving averages on longer periods still remain above the current price.
Those averages often act like a ceiling. Until the asset climbs above them, traders hesitate to declare a trend reversal. In simple terms, the market is resting before choosing its next road.
Short-term charts lean bearish
Shorter timeframes tell a slightly different story. On the four-hour and one-hour charts, the price forms a pattern of lower highs. This structure usually indicates weakening buying pressure.
Because of this pattern, some traders expect the price to test lower liquidity zones. The most discussed levels remain $2,000 and $1,940. However, if buyers reclaim the $2,110–$2,120 range and hold it, that bearish structure would weaken.
Two scenarios traders are watching
A bullish scenario requires a decisive break above $2,150 with strong trading volume. If that happens, the next technical objective appears near $2,380. Beyond that level, the chart opens space toward $2,750.
A bearish scenario begins if Ethereum loses the $2,050 support area. Such a move would likely send the price toward $2,000. If selling pressure continues, the market could slide further to the $1,940 liquidity zone.
Fundamental events behind the market
Two events influence current sentiment. First, the Ethereum Foundation recently sold 5,000 ETH through an over-the-counter transaction to BitMine. The average price of that deal was about $2,042.96. Sales of this type often introduce temporary selling pressure because they increase available supply.
Second, traders look ahead to the planned “Glamsterdam” upgrade expected in the first half of 2026. Developers aim to reduce transaction fees by as much as 78 percent while raising processing capacity to about 10,000 transactions per second.
Many analysts believe the market has not yet priced in the full effect of that upgrade. If the changes deliver the expected improvements, they could influence long-term demand for the network.
Market waiting for a trigger
At this stage, Ethereum sits at a technical crossroads. Price remains compressed between support and resistance, and trading volume stays below average.
Such quiet periods often end with sharp movement. A break above $2,150 or a fall below $2,050 will likely determine the next direction. Until one of those levels breaks, the market continues to wait—like a coiled spring preparing for release.
Author

Isai Alexei
Independent Analyst
I am Isai Alexei. I work as a journalist and financial analyst covering cryptocurrency markets and traditional securities. I have spent ten years analyzing digital assets, trading activity, and market structure.



