Venice Price Forecast: VVV risks bearish reversal amid easing demand and revenue
- Venice holds near $16 on Tuesday, extending consolidation after correcting from all-time highs last week.
- On-chain data show a decline in token staking and burning amid a declining revenue stream, suggesting weaker demand.
- VVV futures Open Interest drops 10% in 24 hours, pointing to a risk-off sentiment among investors.
Venice (VVV) is losing momentum, hovering near $16 at press time on Tuesday, after a rally of around 1,500% over the last six months. The easing of buying pressure is supported by declining token staking, burning, revenues, and retail interest, triggering a near-term sell signal.
Venice is losing on-chain demand and revenue
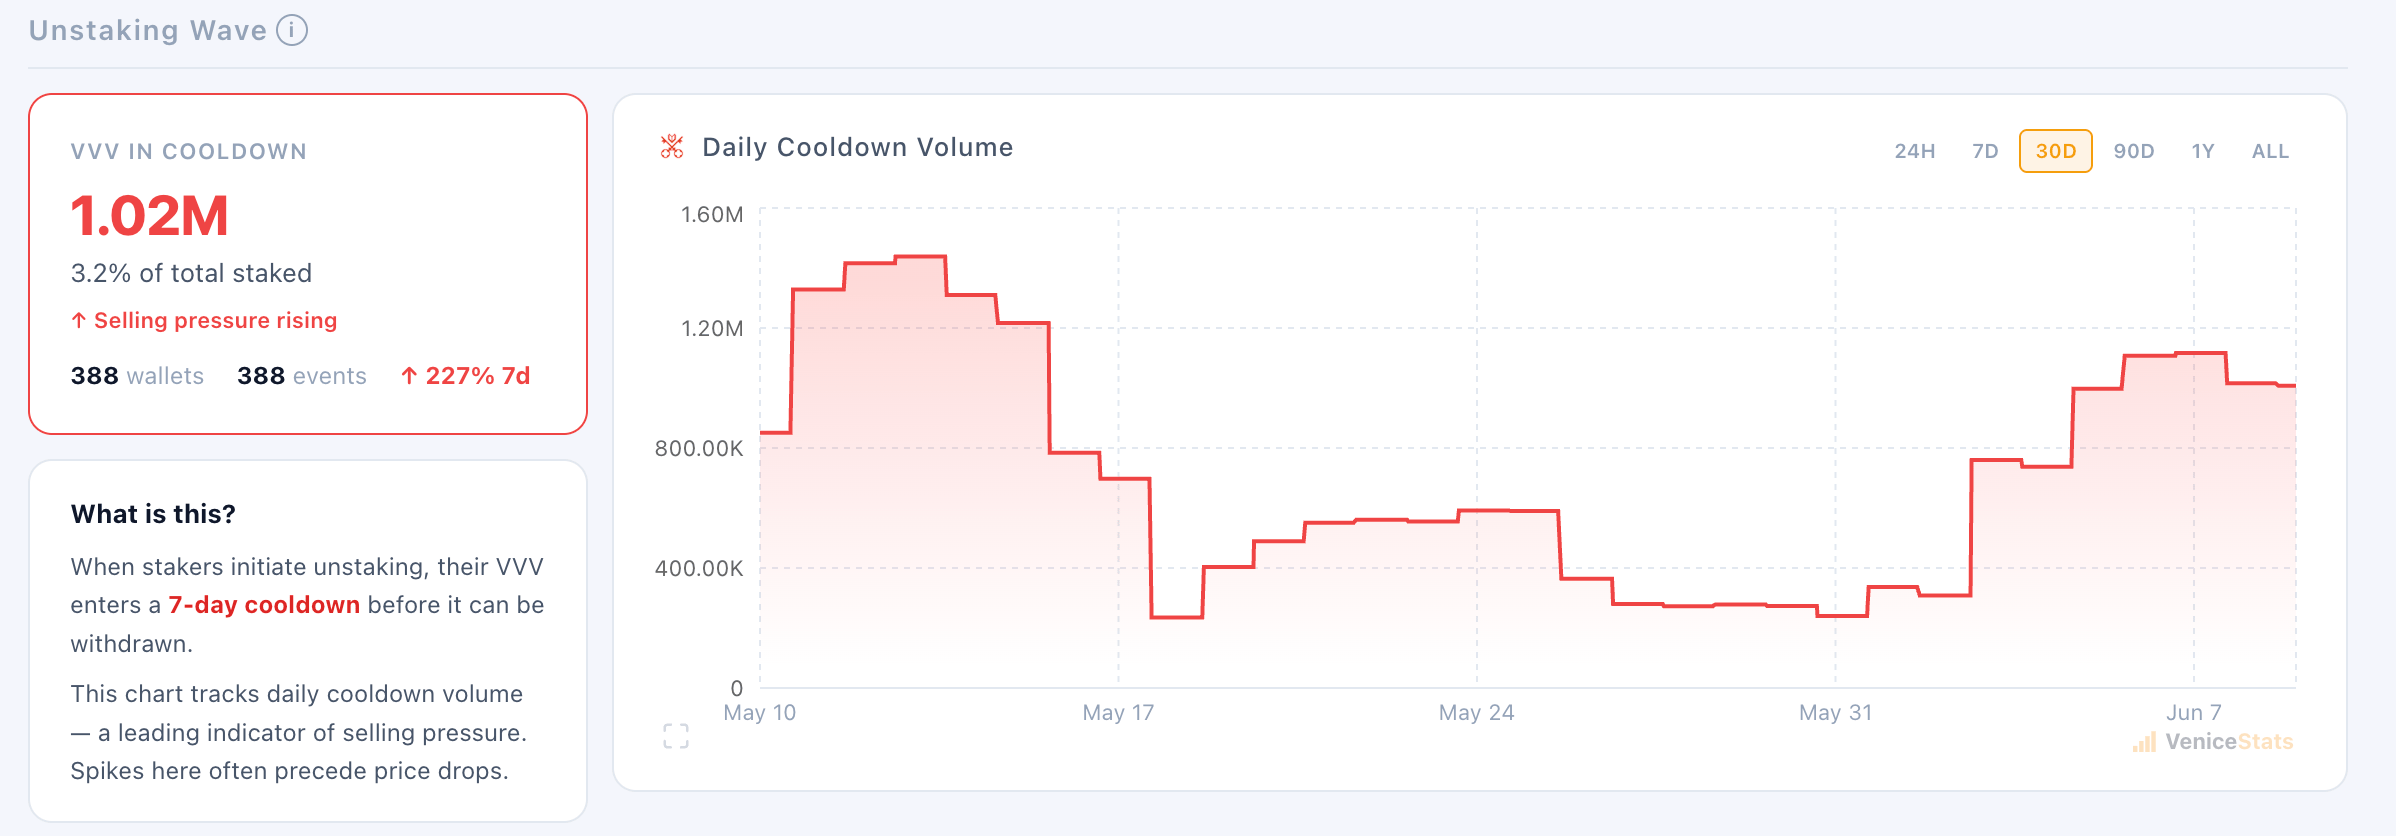
Venice, a privacy-focused AI that stores prompts and files locally, is facing a contraction in network usage. Data from Venicestats suggests that investors are eager to exit their staked VVV positions, with 1.02 million, or 3.2%, of staked volume held in a 7-day cool-down, indicating a potential rise in unlocked supply.
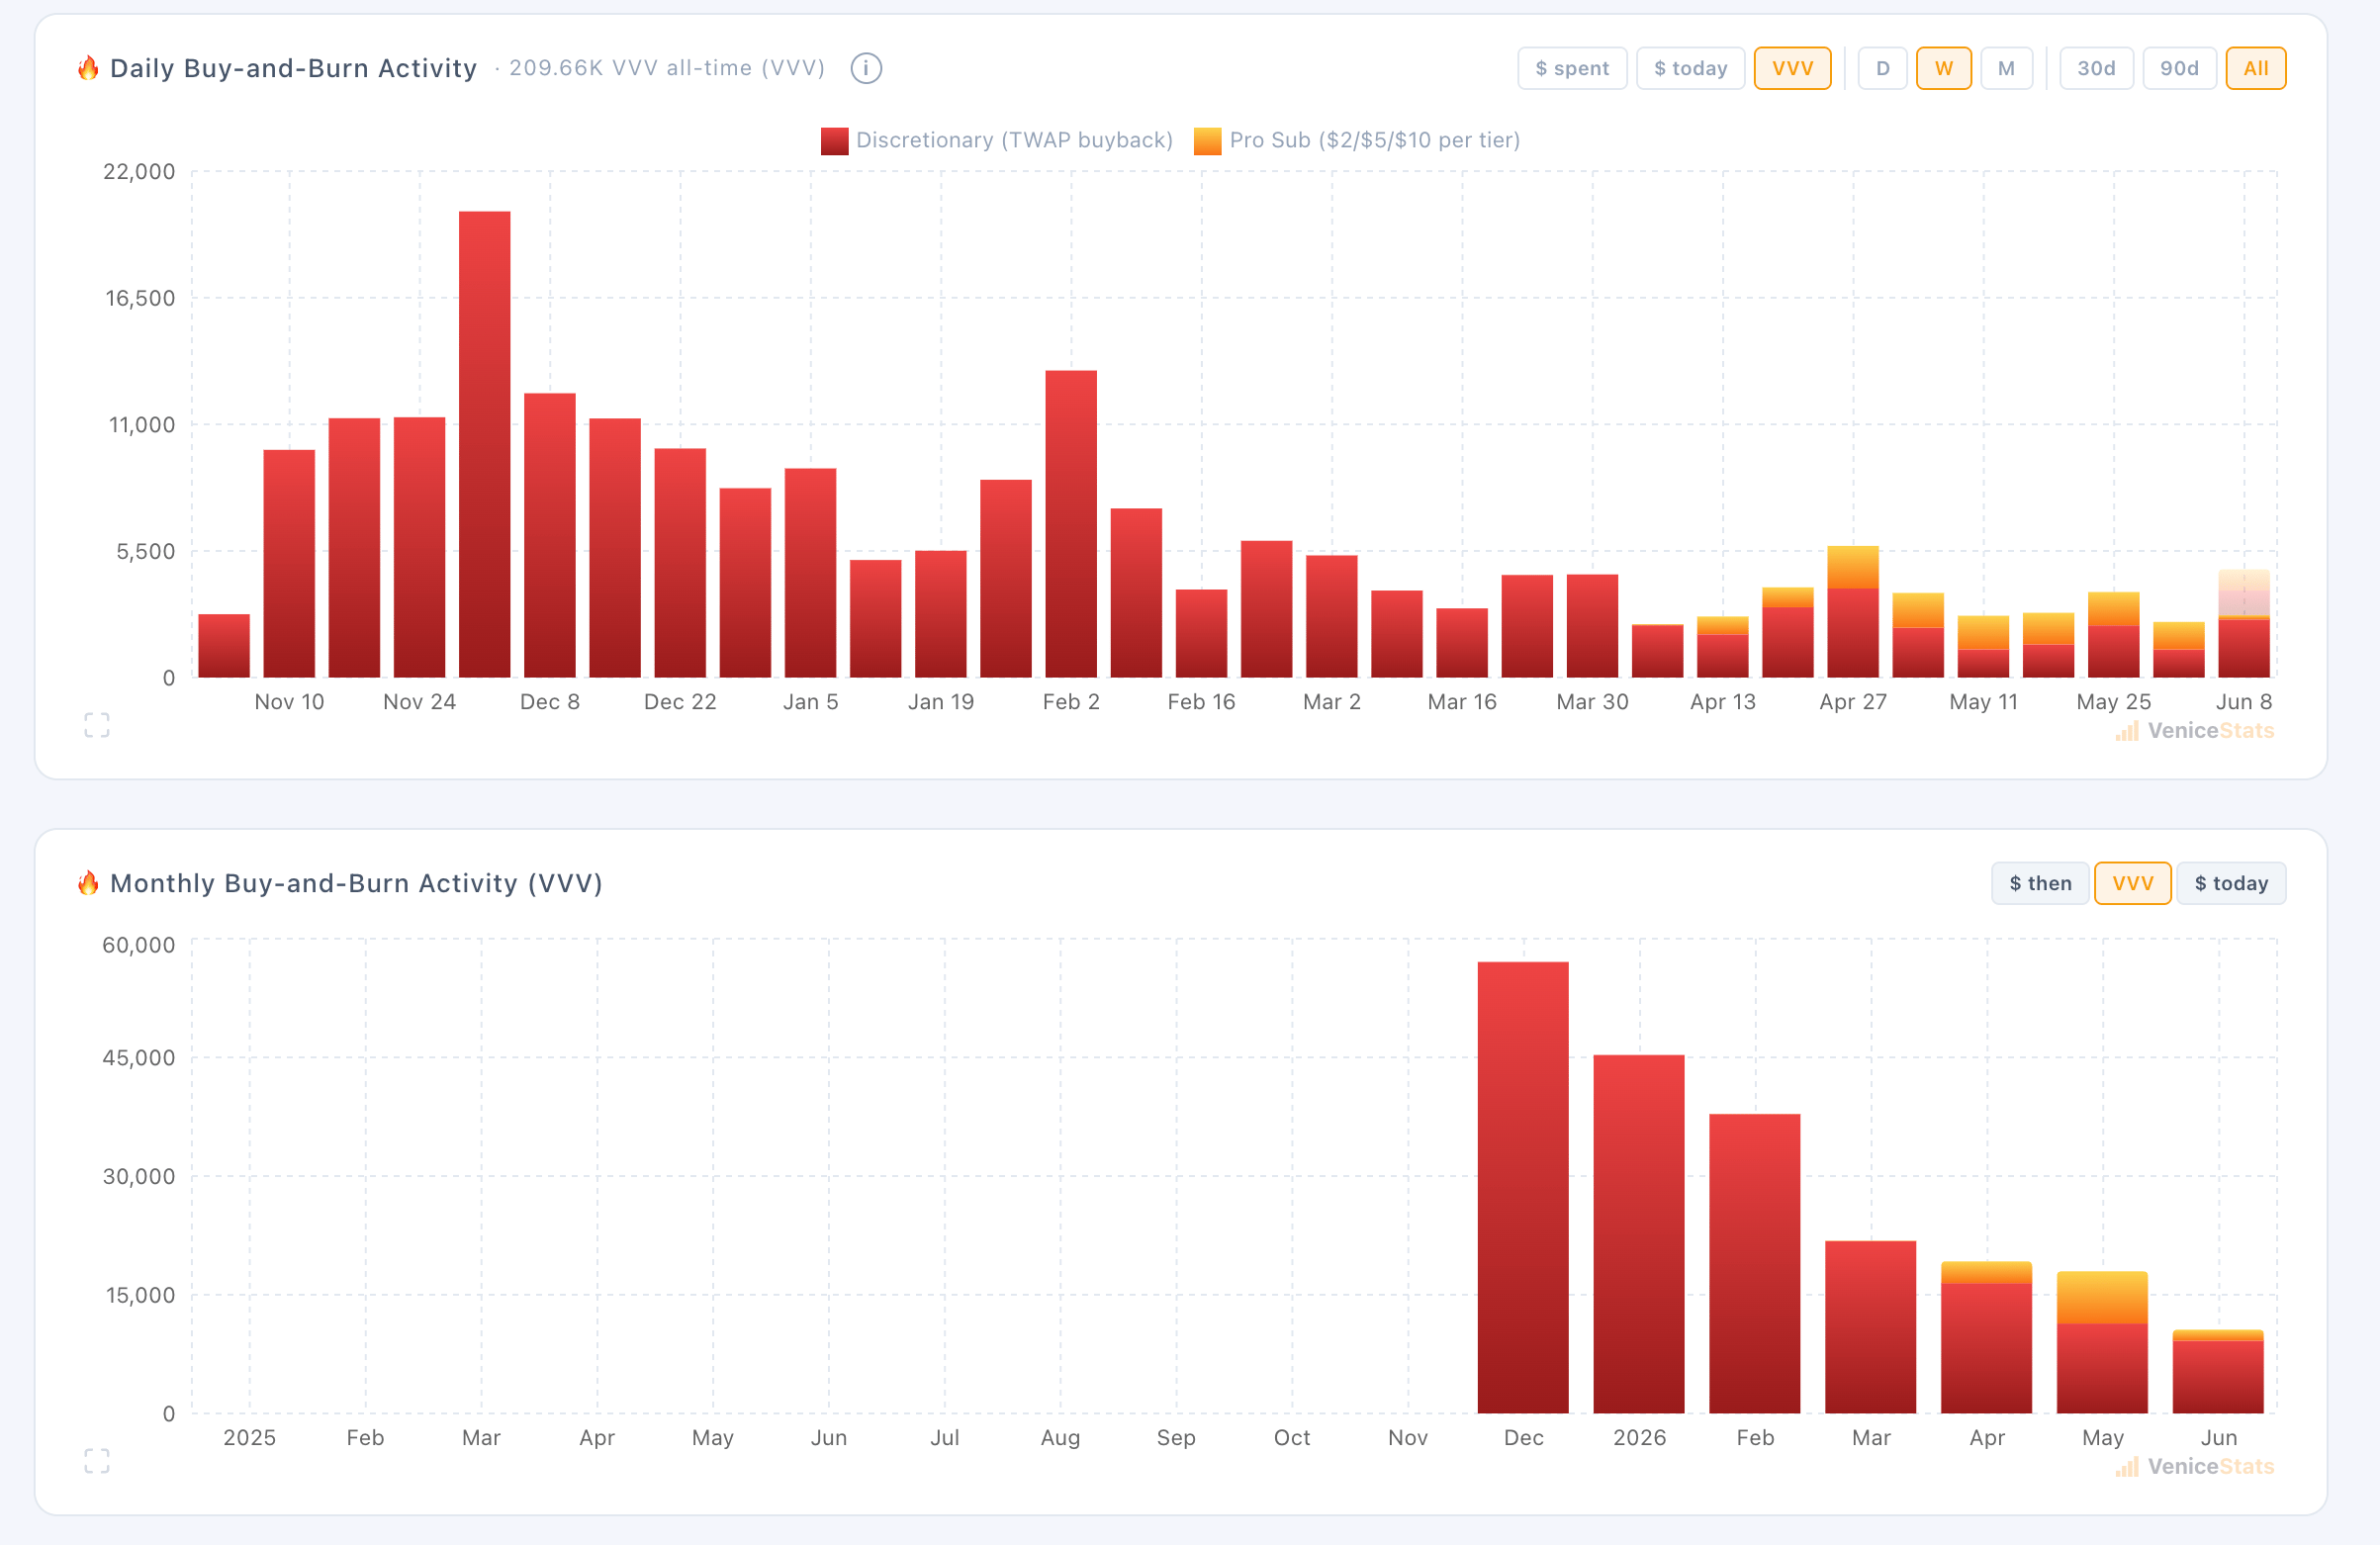
At the same time, buy-and-burn activity driven by buybacks from platform revenue (Discretionary) and subscription-based tiers (Pro sub) is declining, undermining the deflationary status of the VVV token.
Pro sub burning is triggered by subscriptions in which $2 of VVV is burned for Pro, $5 for Pro Plus, and $10 for Max. However, the VVV price surge from $1 to $16 has effectively reduced the number of VVV tokens burned per dollar.
Data shows the weekly total burn dropped to 2,418 tokens last week, down from 20,251 tokens in early December. The monthly burn activity reflects a clear downward trend, positioning the VVV token as less deflationary over time and, in turn, increasing supply pressure.
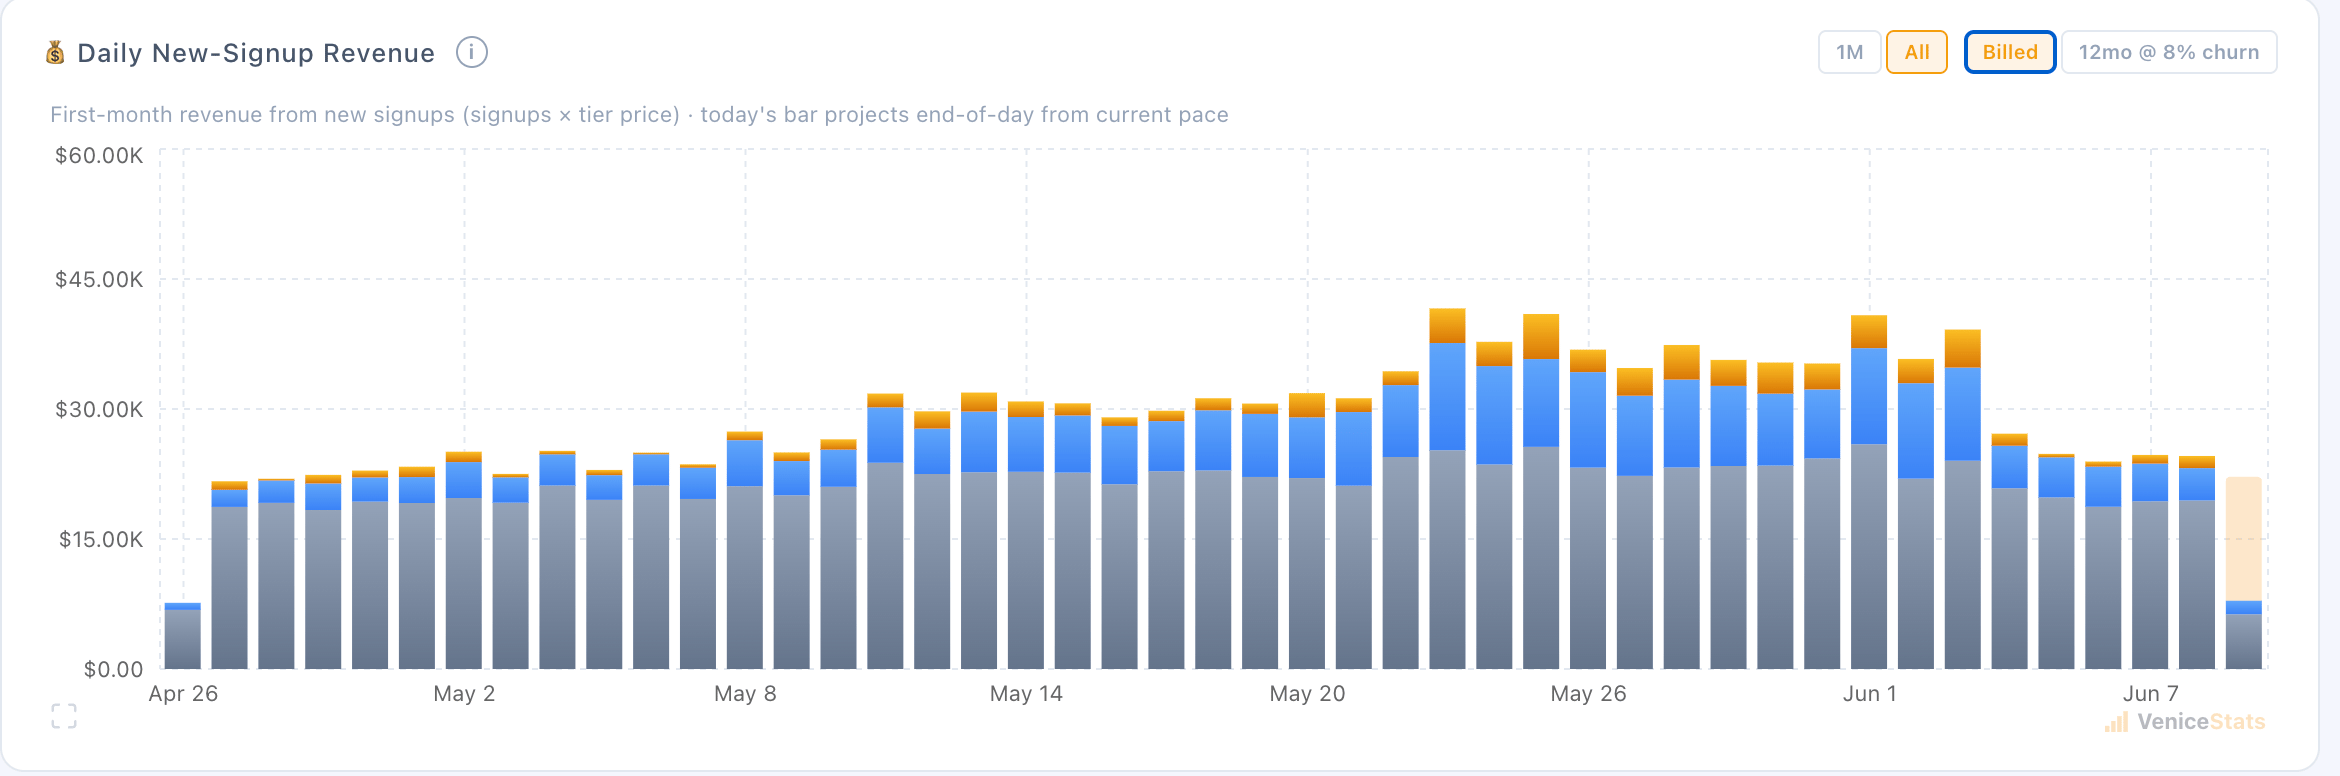
On the other hand, the daily revenue from new signups to Venice AI dropped to $24,580 on Monday, down from a peak of $40,820 on June 1, reflecting a decline in subscriptions, mainly for Pro Plus and Max. Although revenue contracts as the top-tier subscription count declines, the consistent low-tier subscriptions reflect steady adoption, which could signal a long-term positive outlook.
Still, when taken together, the surge in unstaking cool-down volume, supply pressure as deflationary buy-and-burn activity contracts, and falling revenue suggest that demand for Venice is easing and could pave the way for a correction.
Derivatives market shifts sentiment on Venice
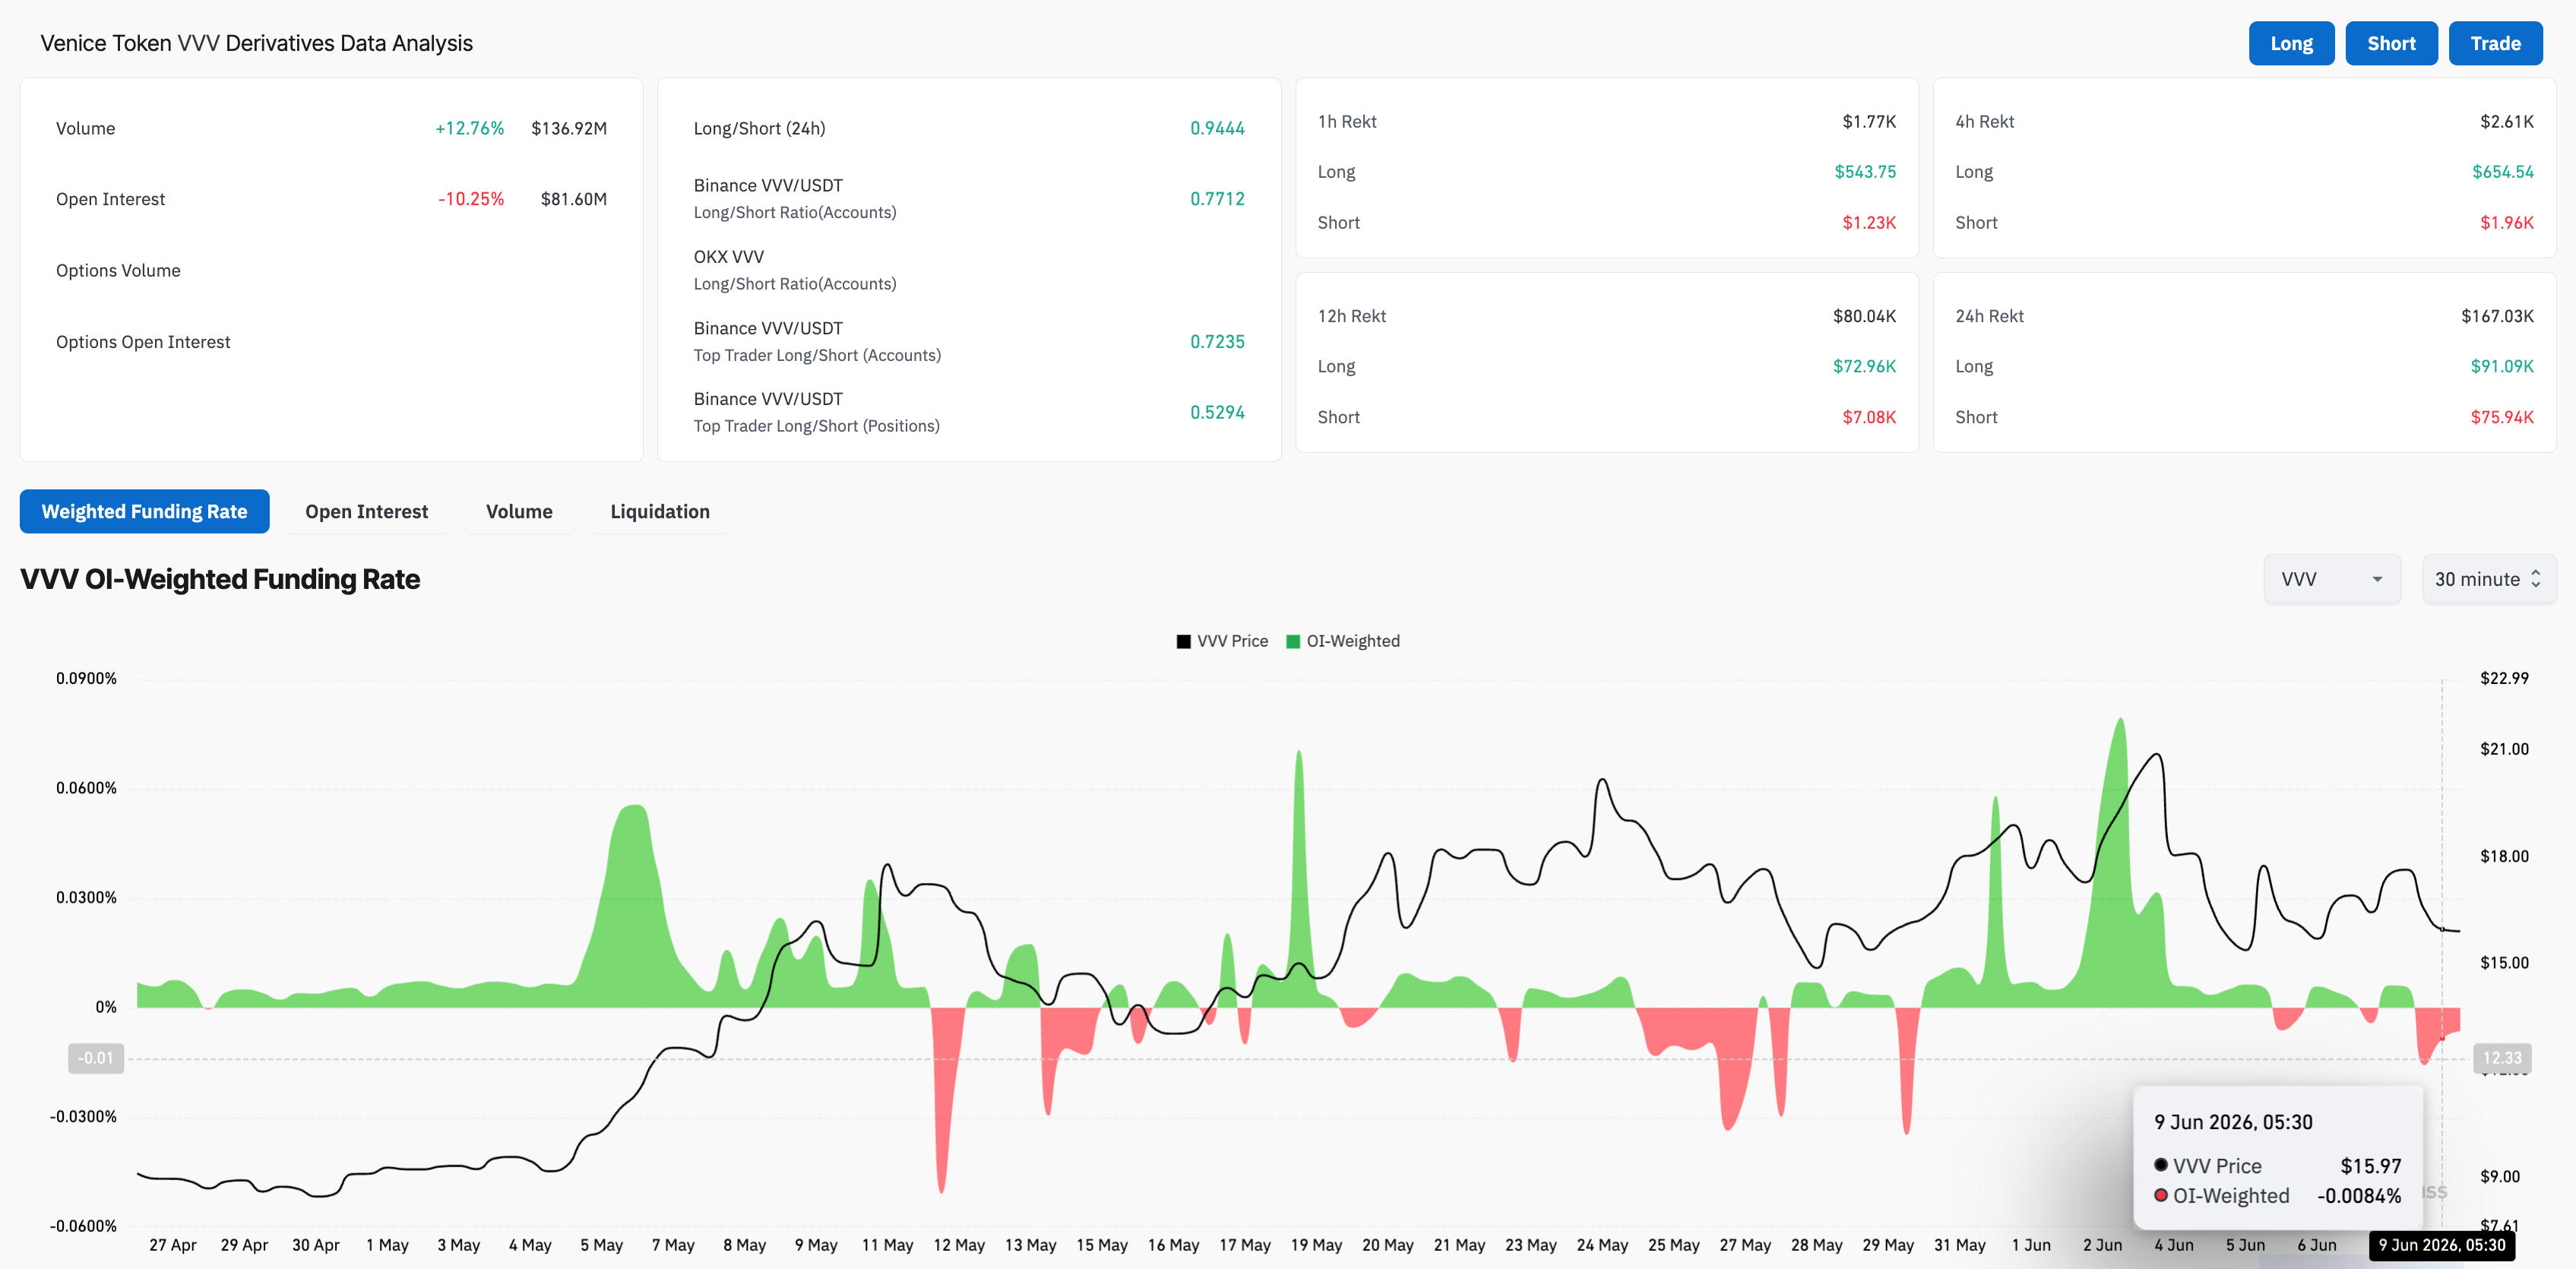
Venice is losing retail support in the derivatives market. CoinGlass data shows the VVV futures Open Interest (OI) dropped by 10% over the last 24 hours to $81.60 million, suggesting a sharp decline in leveraged positions. Meanwhile, the OI-weighted funding rate drops below zero to -0.0084% as buyers are willing to hold short positions at a premium amid a bearish shift in sentiment.
Will the VVV token price fall below $15?
VVV is down over 3% on Tuesday, reflecting a constructive near-term bias. The price holds above the 50-, 100-, and 200-day Exponential Moving Averages (EMAs), with the shorter EMAs above the longer ones.
However, the momentum has cooled as Venice retraces toward an ascending trendline, connecting the lows of February 24 and May 1, near the 50-day EMA at $14.46. The Moving Average Convergence Divergence (MACD) and signal line are in a freefall toward the zero line as the bearish profile expands, while the Relative Strength Index (RSI) at 48 hovers just below the midline, hinting at a consolidative phase rather than outright selling pressure.
On the downside, immediate support is at the 50-day EMA near $14.46, and a daily close below this level would confirm a bearish breakout of the trendline. The 100- and 200-day EMAs, around $11.46 and $8.30, respectively, could provide deeper layers of support.
On the topside, initial resistance emerges at the all-time high of $21.64 from Wednesday, and a daily close above it would put Venice back into price discovery mode.
(The technical analysis of this story was written with the help of an AI tool.)
Author

Vishal Dixit
FXStreet
Vishal Dixit holds a B.Sc. in Chemistry from Wilson College but found his true calling in the world of crypto.



