VeChain Elliott Wave technical analysis [Video]
![VeChain Elliott Wave technical analysis [Video]](https://editorial.fxstreet.com/images/Markets/Currencies/Cryptocurrencies/VeChain/vechain-150x150logo-637399983192838290.png)
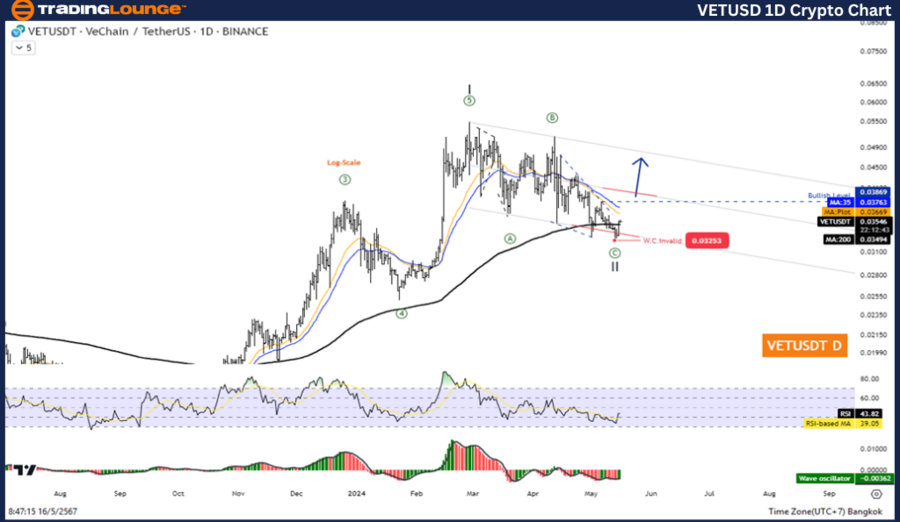
Elliott Wave Analysis TradingLounge daily chart.
VeChain/ U.S. dollar(VETUSD)
VET/USD Elliott Wave technical analysis
Function: Counter trend
Mode: Corrective
Structure: Flat
Position: Wave ((C))
Direction next higher degrees: Wave II of Impulse
Wave cancel invalid level: 0.2100
Details: Wave II May is complete and the price increase again in Wave III
VeChain/ U.S. dollar(VETUSD) Trading strategy: The correction in Wave II appears to be complete at the 0.032 level and the price is resuming the upward trend. Therefore, looking for Opportunity to join the uptrend You may have to wait for confirmation. After the price rose above 0.0386
VeChain/ U.S. dollar(VETUSD)Technical Indicators: The price is below the MA200 indicating a downtrend, The Wave Oscillator is a Bullish Momentum.
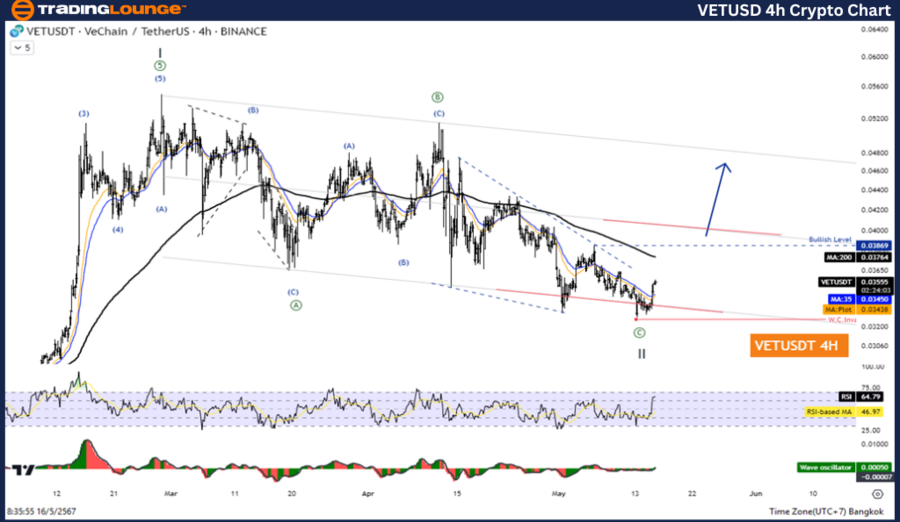
VeChain Elliott Wave analysis four-hour chart
Function: Counter trend.
Mode: Corrective.
Structure: Flat.
Position: Wave ((C)).
Direction next higher degrees: Wave II of Impulse.
Wave cancel invalid level: 0.2100.
Details: Wave II May is complete and the price increase again in Wave III.
VeChain/ U.S. dollar(VETUSD)Trading Strategy: The correction in Wave II appears to be complete at the 0.032 level and the price is resuming the upward trend. Therefore, looking for Opportunity to join the uptrend You may have to wait for confirmation. After the price rose above 0.0386
VeChain/ U.S. dollar(VETUSD)Technical Indicators: The price is below the MA200 indicating a downtrend, The Wave Oscillator is a Bullish Momentum.
VeChain Elliott Wave technical analysis [Video]
Author

Peter Mathers
TradingLounge
Peter Mathers started actively trading in 1982. He began his career at Hoei and Shoin, a Japanese futures trading company.


