Top 3 price predictions for Bitcoin, Ethereum & Ripple: fast short-term analysis
- Bitcoin is testing a recent support at $9188, targets now $9520
- Ethereum reaches its primary bullish target at $670. If that level is breached, then $800 awaits

Diverse technical situations are showing today in the main Cryptocurrencies. While Bitcoin is trading above the last resistance (now turned support) and has room to keep going, Ethereum has met the ceiling of a broad bearish channel which, surprisingly, has only been able to hold its progression for a few hours.
ETH/USD 4H chart
-636601600722761357.png)
The notable bullish trajectory of Ethereum has resolved in a very positive way its meeting with an important bearish trend. It has only taken 4 hours to break above that barrier after a brief retracement and now ETH has initiated a new bullish leg clearly above there. This barrier is still close and not totally out of play, and it will take a surge above $700 to leave it completely behind.
Resistance is located in the aforementioned $700 level, followed by $737. Above there, the psychological level of $800 would take ETH/USD to a sharply bullish scenario. Support is at the $670 mark, where the trendline just breached is set. If Ethereum dips below there, the door to some bearish trading sessions is open, with $620 being the next target downwards.
MACD in the Ethereum 4-hour chart has gone back to a bullish slope, but still keeping the low opening it's been showing in the previous sessions. The indicator has reached new positive levels and is now getting rid of possible divergences, supporting more bullish action for ETH/USD.
Directional Movement Index in the Ethereum 4-hour chart is showing how buyers have been gathering strength again and are positioned slightly above the ADX. Keeping this scenario will be necessary to avoid falling back below support levels, which would complicate its short-term outlook.
BTC/USD 4H chart
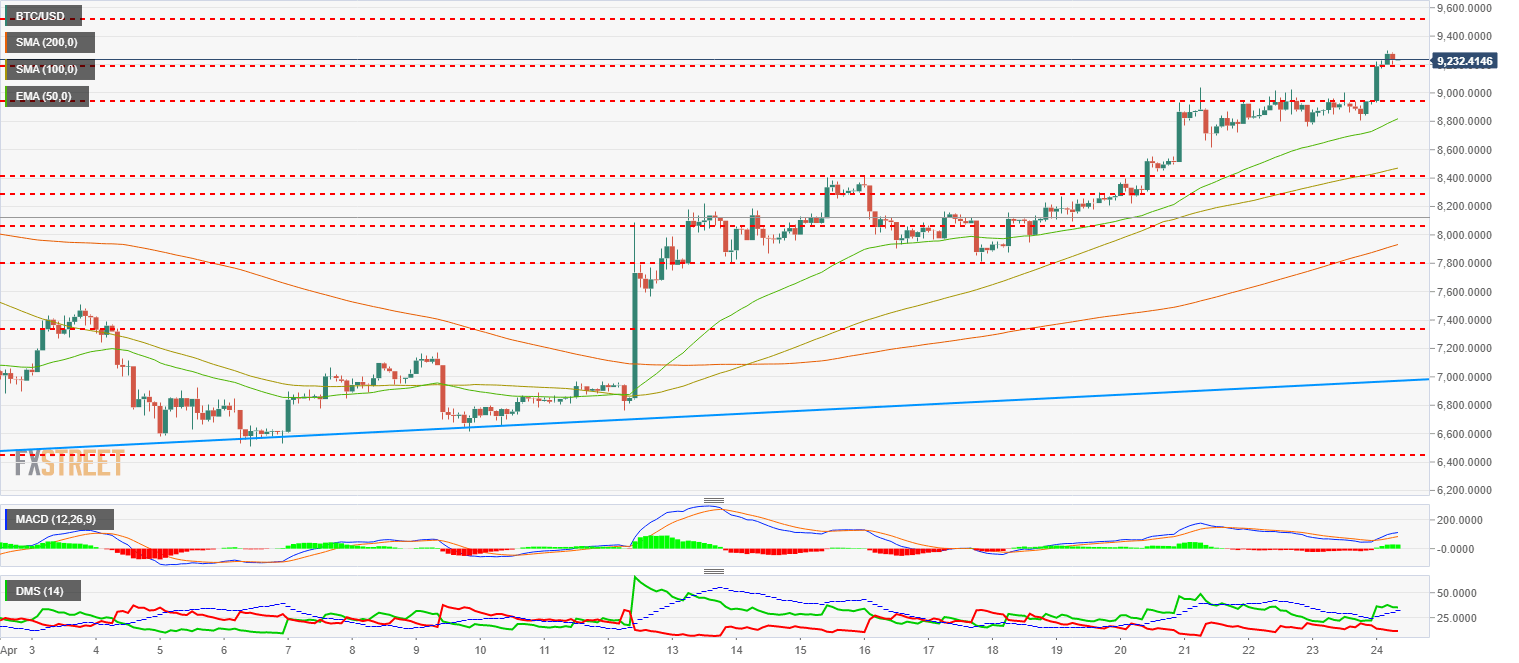
Bitcoin is trading above the $9250 while it's getting close to the meaningful $10000 level. To get there, it will first need to break above $9530 and then $9836. Below there, $9000 is the primary support level, followed by $8750.
MACD in the Bitcoin 4-hour chart is showing a bullish inclination, although with barely any openings. It's still lacking new bullish levels, so there is a divergent structure with the BTC/USD price action. Not an alarming situation, but one to keep an eye on.
Directional Movement Index in the Bitcoin 4-hour chart has recovered the level above ADX and has renovated its bullish impulse, while the sellers have been slowly diminishing. ADX is still at high levels, confirming a possible continuation of the bullish movement.
XRP/USD 4H chart
-636601601307145687.png)
Ripple has broken above the triangle that was containing its price action since last April 20th. XRP/USD has not been able to reach new relative highs, so its progression is still very doubtful. XRP still needs to break above its close above $0.9386 to avoid the formation of a rectangle that would complicate the short and mid-term evolution of the asset.
Ripple has shown a weaker profile than the other Cryptocurrencies analyzed, something reasonable if we take into account the meaningful bullish strides that XRP has been taking during the month of April.
MACD in the Ripple 4-hour chart is showing an unresolved profile, with the mean line close to crossing the signal line, which would take the price to superior levels. A cross failure would significantly damage the XRP/USD.
Directional Movement Index in the Ripple 4-hour chart is showing the buyers losing strength despite still being above the sellers, that can't seem to find reasons to increase their positioning.
Author

Tomas Salles
FXStreet
Tomàs Sallés was born in Barcelona in 1972, he is a certified technical analyst after having completing specialized courses in Spain and Switzerland. He expanded his technical training following the guidance of great experts on the financial markets.


