Top 3 Price Predictions: Bitcoin bounce has two targets, Ethereum confirms big breakout, Ripple rights the ship– Confluence Detector
- Bitcoin, Ethereum, and Ripple are on the rise after dropping over the weekend.
- The three cryptocurrencies have new targets set for them on the upside.
- The Confluence Detector shows clusters of technical levels according to their importance.

BTC/USD has two targets
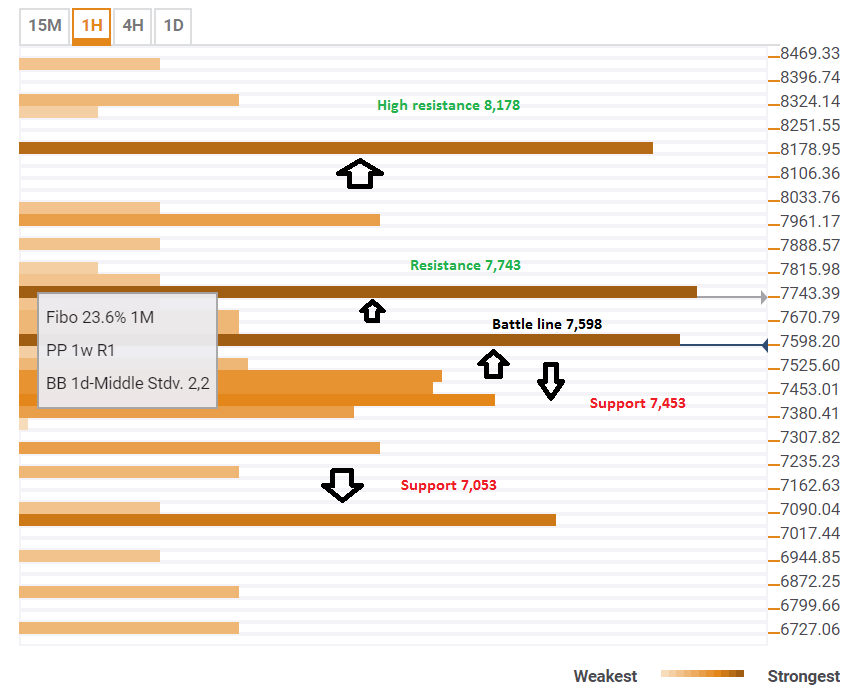
After rising from the lows, the price of Bitcoin faces an initial hurdle at $7,598 which is the convergence of the Fibonacci 38.2% one'day, the Simple Moving Average 5'1d, the SMA 100'1h, the 4h'high, and the Bolinger Band one-hour Middle.
Yet it faces two higher and more interesting targets above: $7,743 is the confluence of the Fibonacci 23.6% one-month, the Pivot Point one-week Resistance 1, and the Bolinger Band one-day Middle. Further above, the $81,78 level is the Fibonacci 38.2% one-month which is backed up by the SMA 200-4h.
Looking down, Bitcoin has some support waiting at $7,453 which is the congestion of the Simple Moving Average 50-15m, the SMA 10-1h, the Bolinger Band 15m-Middle Stdv. 2.2, the SMA-5, the SMA-10-one day, the Bolinger Band one-hour Middle, and the Fibonacci 38.2% one-week
Further down, $7,053 is the meeting point of the one-month low and the one-week low.
This is how it looks:
ETH/USD major breakout
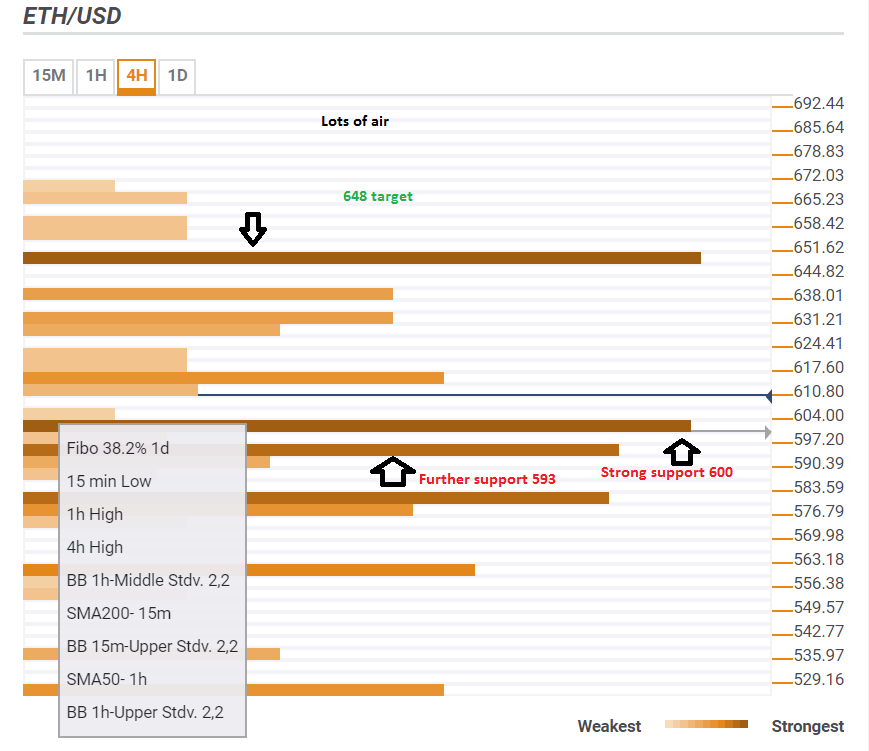
The Ethereum Price moved above a major level of resistance around $600. This is the congestion of the Fibonacci 38.2% one-day, the 4h-high, the Bolinger Band 1h-Middle, the Simple Moving Average 200-15m, the Bolinger Band 15m-Upper, the SMA 50-1h, and the Bolinger Band 1h-Upper.
Earlier, ETH/USD moved above $593 which is the convergence of the Fibonacci 23.6% one-day, the one-week high, the SMA 10-15m, and the SMA 5-1d.
So, what's next? $648 remains a key target: it is the confluence of the all-important Pivot Point one-day Resistance 2, the Fibonacci 161.8% one-week, and the Pivot Point one-week Resistance 2. Above that level, there are no significant limits at least until $700.
Here is how it looks:
XRP/USD has further targets
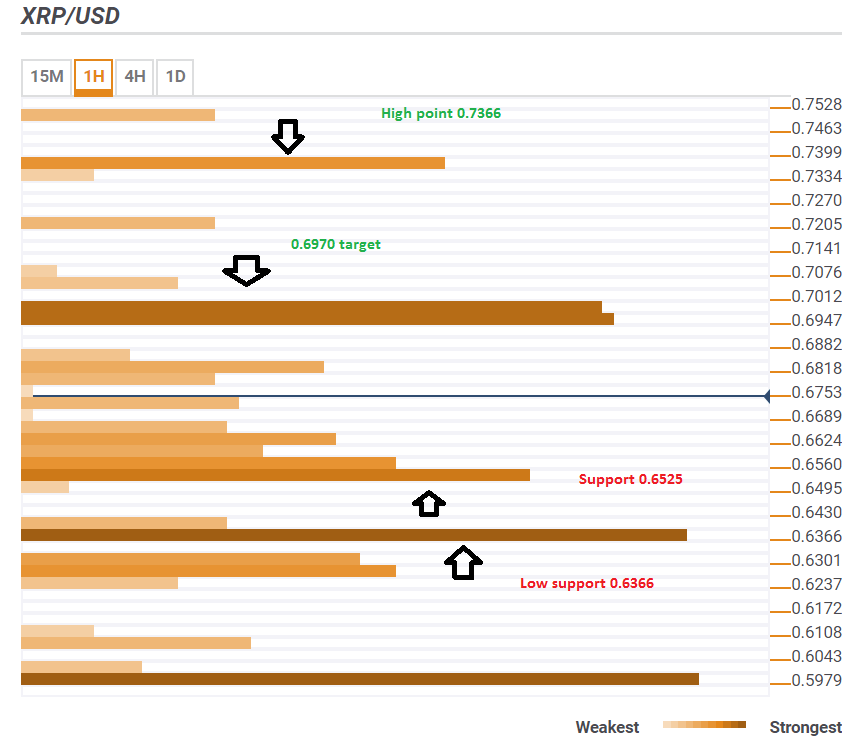
The price of Ripple is moving up as well and faces a clear resistance area around $0.6970. At this level, XRP/USD meets the Fibonacci 38.2% one-month, the Pivot Point one-day Resistance 1, and the Simple Moving Average 200-4h.
The next target is $0.7366 which is the convergence of the Pivot Point one-week Resistance 3 and the Pivot Point one-day Resistance 2.
Looking down, support awaits at $0.6525 is the confluence of the Bolinger Band 15m-Lower, the Pivot Point one-week Resistance 1, and the Fibonacci 23.6% one-day. Lower, $0.6366 is a support line as it is the one-day high and the Fibonacci 23.6% one-month, a very powerful line.
This is how it looks:
The Confluence Detector finds exciting opportunities using Technical Confluences. The TC is a tool to locate and point out those price levels where there is a congestion of indicators, moving averages, Fibonacci levels, Pivot Points, etc. Knowing where these congestion points are located is very useful for the trader, and can be used as a basis for different strategies.
This tool assigns a certain amount of “weight” to each indicator, and this “weight” can influence adjacents price levels. These weightings mean that one price level without any indicator or moving average but under the influence of two “strongly weighted” levels accumulate more resistance than their neighbors. In these cases, the tool signals resistance in apparently empty areas.
Author

Yohay Elam
FXStreet
Yohay is in Forex since 2008 when he founded Forex Crunch, a blog crafted in his free time that turned into a fully-fledged currency website later sold to Finixio.



