Top 3 Bitcoin, Ethereum & Ripple price prediction: technical contradictions, price action to dictate decision-making
- Bearish action across the Crypto board might extend until the weekend
- Technical scenarios have been developing sticking to expectations, taking prices back to targeted supports

The falls seen yesterday in the Cryptocurrency markets didn't catch us by surprise. First targets were reached but didn't hold as the bullish leg run out of gas, necessary making way for a consolidation phase.
Lower price levels are not out of the cards, but it is not the most probable scenario. The moving averages location, just above the price level in the 4-hour charts, favor a bearish lateral scenario, with a possible increase of volatility as the day advances.
BTC/USD 4H chart
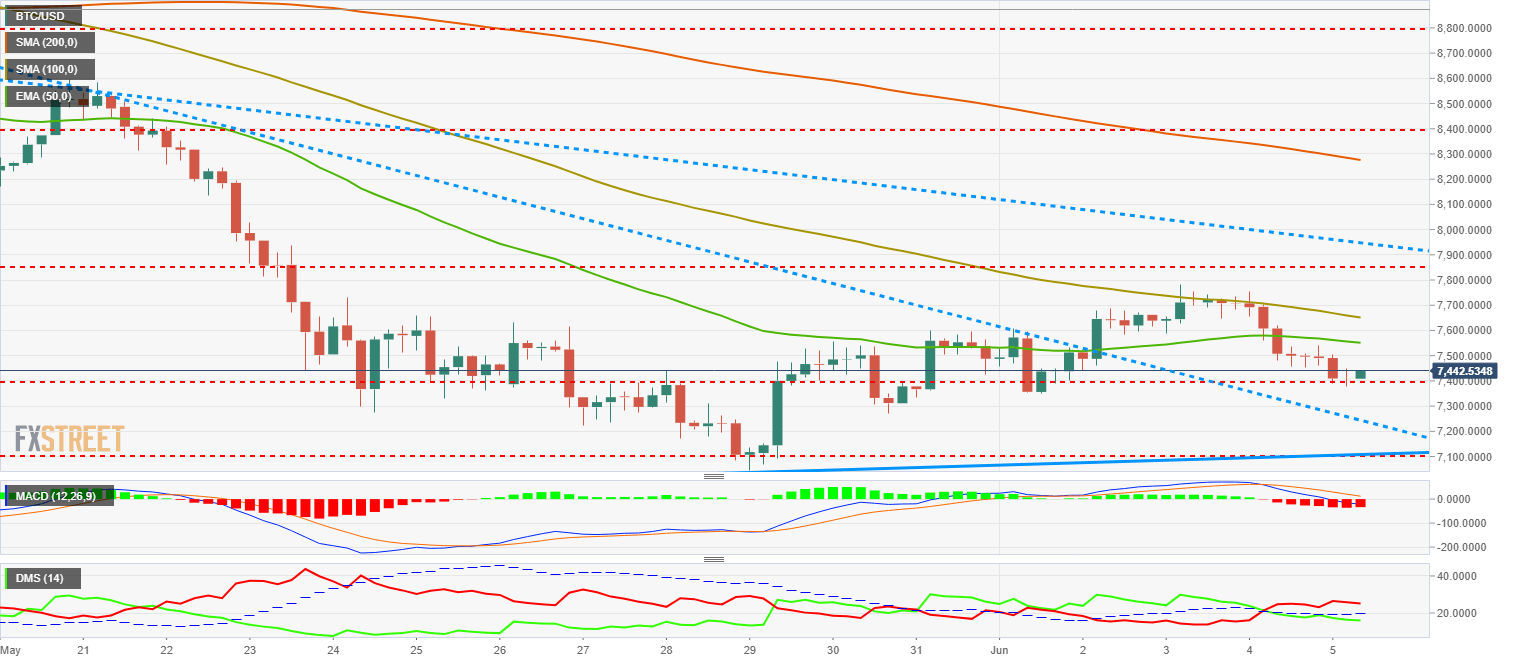
Bitcoin reached the primary target at $7400 during the early Asian trading session, right where BTC/USD has stopped its run. Bitcoin has left a Doji after a mid-sized candlestick, so we could see a turning formation during the American session.
On the upside, the first target is at the 50-EMA, located now at the $7550 mark, followed then by the 100-SMA at the $7650 level. Breaching that level would be very bullish for BTC/USD, although it is not the most likely scenario. Further above, there is another price resistance level at $7870 that would leave Bitcoin at the doors of a technically important trendline at $7950.
On the bearish side, the first support is at the current price ($7400), with a possible extension down to $7359. If that level is lost, Bitcoin would fall straight down to the more accelerated trendline that is located at the $7230 level.
MACD in the Bitcoin 4-hour chart is still showing some room to cover on the bearish side, particularly if we consider that it is trading on the positive side of the indicator, losing some strength. Potential bearish lateral moves look quite likely with an increase of volatility, which could lead to a change of direction.
Directional Movement Index in the same chart is showing buyers in retreat since the $7700 level was reached. Sellers, on the other hand, have been increasing their positions as the price action started weakening, but have quieted in the last hours, not showing much confidence in more falls.
ETH/USD 4H chart
-636637897551404402.png)
Ethereum fell down yesterday to $580 just before bouncing to the price congestion support at $587. However, the 50-EMA at the $590 mark was lost and has been barely recovered at the time of writing this article.
ETH/USD is stuck in a tight falling wedge, barely in a $70 range, where the 50-EMA, the 100-SMA and two significant price levels ($587 and $565) meet.
Given the current scenario, every level is important, with the most important one to track on the upside being the 100-SMA located at the $602 mark and the falling wedge superior trendline at $605. If those levels are broken to the upside, Ethereum would enter a much more positive scenario that would quickly take the $620 mark back.
On the bearish side, the first support is on the 50-EMA at $590, which would take the price back to the inferior trendline located at $570. If that level is lost, ETH/USD would enter a scenario open to new falls, with the first support being very close to the $567 mark. That would be the last stop before very important falls that would target $520.
MACD in the Ethereum 4-hour chart shows how the bearish movement is losing steam and both the mid-line and the signal one are flattening quickly, proposing a bullish cross attempt. This is a very premature try and will probably fail. We should still consider this as lateral with a neutral profile.
Directional Movement Index in the same chart is gifting us another setup favorable for confusion. Buyers and sellers are close to being even, with a profile that proposes an increase on the buyers' side. Technical setups such as this one usually allow confusing movements that might result in a contrarian outcome. The outlook is lateral with bullish potential, but we should wait and see.
XRP/USD 4H chart
-636637897841418319.png)
Ripple is trading inside a wide-open technical scenario, but with multiple resistances and supports complicating any development. The indicators are set up quite differently than the other two assets analyzed.
On the upside, the first resistance is located at $0.66, immediately followed by the trendline located at $0.67 that protects the doors to a net bullish territory. We can find another price congestion resistance at $0.679, which strengthens the wall behind the bulls paradise.
On the downside, the first support is at the 50-EMA ($0.635), followed by a price congestion support at $0.63. If that level was lost, the bearish target would clearly be at $0.60.
MACD in the Ripple 4-hour chart shows a similar profile than the Ethereum one, although a bit more advanced. This is an optimal profile for a bullish cross, but also for a bull trap. We recommend to wait to confirm the breakout and latter consolidation before taking any positions.
Directional Movement Index in the same chart still gives some edge to the buyers, that might take back the ADX line. If that happens, it would be a very strong bullish signal. Sellers have increased a lot during the last dip, but are losing some strength today, not showing much confidence to more falls.
Author

Tomas Salles
FXStreet
Tomàs Sallés was born in Barcelona in 1972, he is a certified technical analyst after having completing specialized courses in Spain and Switzerland. He expanded his technical training following the guidance of great experts on the financial markets.


