Top 3 Bitcoin, Ethereum and Ripple Price Predictions: rueful trip to the South - Confluence Levels
- BTC/USD broke below the support level.
- ETH/USD will move lower as it's the path of least resistance.
- XRP/USD jammed between support and resistance areas.

Bitcoin could not hold the ground on Thursday and resumed the downside, while other top cryptocurrencies just followed the lead. Lack of convincing fundamental factors leaves the market to the mercy of technical trading and speculative positioning within the established short-term range. The digital coin No.1 has lost about 5% in August, but it is still can be qualified as a healthy correction after a sharp rally in July.
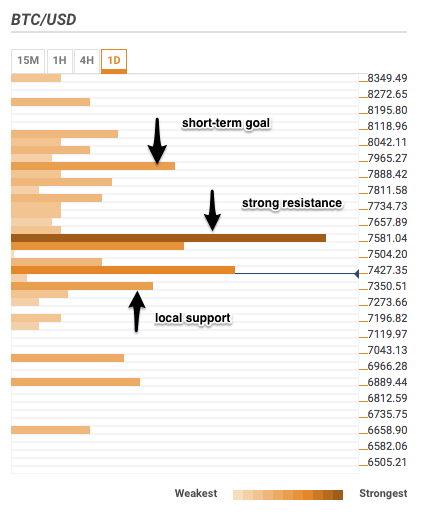
BTC/USD 1D
BTCUSD is sandwiched between strong confluence areas, which means that some period of consolidation may be in store for us. Both bulls and bears have to mobilize energy for a significant breakthrough that will define the momentum for the nearest future.
BTC/USD slipped to $7,285 early on Friday as the support around $7,600 gave way. The coin touched the lowest level since July 23 amid global sell-off on the cryptocurrency markets. Currently, BTC/USD sits at $7,370, while new support is created at $7,350 by a confluence of technical indicators, including Pivot Point one-day Support 1, Bollinger Band 15 min -Middle, SMA10 - 15 min, SMA5 - 15 min.
Once it is cleared, the downside may be extended to Pivot Point one-day Support 3 at $7,7150, though this support can be taken out quickly, dragging BTC towards psychological $7,000, followed by 61.8% Fibo retracement monthly.
Above the current price, the stiff resistance is located on the approach to $7,600. This area includes quite a few critical technical indicators, which include:
Fibonacci 38.2% daily and monthly, and SMA100 (daily) Bollinger Band daily -Middle, with Fibonacci 23.6% daily, Pivot Point one-day Resistance 1, and a host of SMAs on approach.
Area $7,800 is the ultimate bullish goal for the time being. The next hurdle comes at $7,931 with 23.6% Fibonacci retracement and Pivot Point one-day Resistance 2. Once this area is cleared, the upside may be extended towards psychological $8,000.
Click to see the Full Confluence Indicator
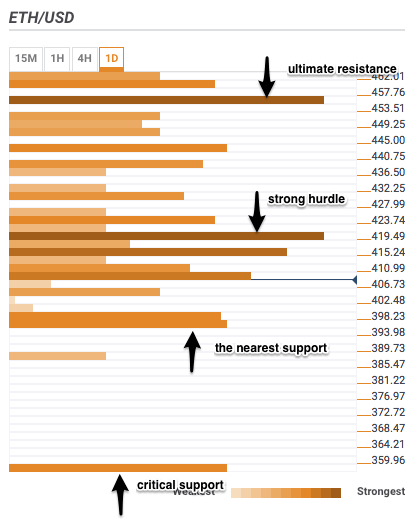
ETH/USD 1D
The second digital coin by market capitalization is trading at $406, down 2.5% on a daily basis and 1% lower since the beginning of Friday. ETH/USD touched $397 low during early Asian hours before stabilizing marginally above $00 handle. A cluster of technical levels below the current price include:
The 4 -hour low, the Bolinger Band 15m-Lower, Pivot Point one-day Support 2, Pivot Point one-month Support 1, and Bolinger Band 4h-Lower
Below this area there are no significant support lines until 2018 low at $352, strengthened by Pivot Point one-month Support 2.
The nearest resistance comes just above the current price, created by a confluence of the one-hour high, 4-hour high, 15 min high, one day high together with Bollinger Band 15 min -Upper and Bollinger Band 1day -Middle. It is followed by 38.2% Fibo retracement daily, SMA10 - 4-hour. SMA50 - 1-hour and SMA200 - 15 min. Then go 61.8% Fibo retracement and last month low around $420. The critical hurdle comes at $460 (SMA10-Daily, 38.2% Fibo retracement monthly.
Basically, all the way up is riddled with resistance levels, which means that the downside movement is the path of least resistance.
Click to see the Full Confluence Indicator
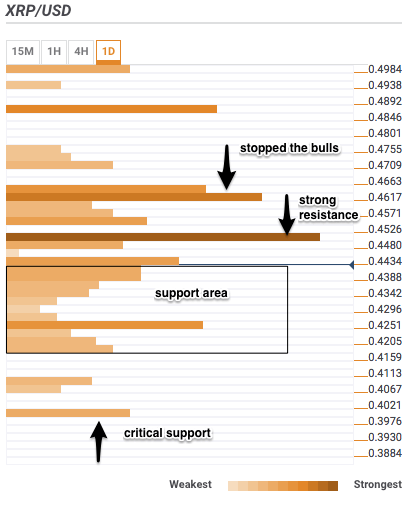
XRP/USD 1D
Ripple is changing hands at $0.4576. The third largest coin is mostly unchanged both since the start of Friday and on a daily basis.
Below the current price, the local support area goes all the way down from the current price to $0.4130. The confluence of technical indicators located in this area include:
A host of SMAs, 1-hour low, 1 day low, 4-hour low, last month low, 23.6% Fibonacci retracement daily, 161.8% Fibonacci retracement weekly, Pivot Point one-week Support 2, Pivot Point one-day Support 2, Pivot Point one-day Support 1, Bollinger Band 1-hour -Middle, Bollinger Band 1-hour -Lower, Bollinger Band 4-hour -Lower, Bollinger Band 15-min -Lower.
XRP is well supported on its way down; however, if the above-said area is passed, the sell-off may be extended towards psychological $0.4000, followed by Pivot Point one-month Support 1.
There are also quite a number of resistance levels on the way up: a confluence of Fibonacci retracement levels (23.6% monthly, and 61.8% weekly), Bollinger Band 4-hour -Upper, 1-day high and SMA10-daily) is likely to stop the recovery at $0.4500.
Once this area is cleared, the upside may be extended towards $0.4600. This area stopped XRP during the recent upside. It is followed by 161.8% Fibonacci retracement daily, SMA200 - 4-hour and Pivot Point one-day Resistance 1.
Click to see the Full Confluence Indicator
Author

Tanya Abrosimova
Independent Analyst


