Three reasons why the Official Trump meme coin could hit new year-to-date lows
- Official Trump price continues its decline on Friday, extending the correction for the second consecutive week.
- Santiment data shows that certain large whales are reducing their exposure to TRUMP tokens, fueling selling pressure.
- Derivatives data and technical outlook show a bearish bias, suggesting the meme coin could be heading to year-to-date lows.

Official Trump meme coin (TRUMP) price remains under pressure, trading below $3.05 at the time of writing on Friday amid bearish sentiment. Fading whale confidence, weakening derivatives data and deteriorating technical structure suggest that the meme coin could correct further, potentially marking a new yearly low.
Whales decreasing exposure
Santiment’s Supply Distribution data supports a bearish outlook for the Official Trump meme coin, as the number of large-wallet holders, commonly known as whales, is reducing exposure.
The metric shows that whales holding between 100,000 and 1 million tokens (red line in the chart below) and between 10 million and 100 million tokens (blue line) have shed a total of 16.31 trillion tokens since March 14. In the same period, whales holding between 1 million and 10 million tokens (yellow line) have accumulated 15.33 trillion TRUMP tokens. This indicates a shift in positioning among large wallets, with certain top-tier whales reducing exposure. In contrast, mid-sized whales absorb some of the supply, often reflecting distribution at higher levels and adding to near-term downside risks for Official Trump meme coin.
 [15-1774608092702-1774608092719.45.19, 27 Mar, 2026].png)
Derivatives data shows fading investor interest
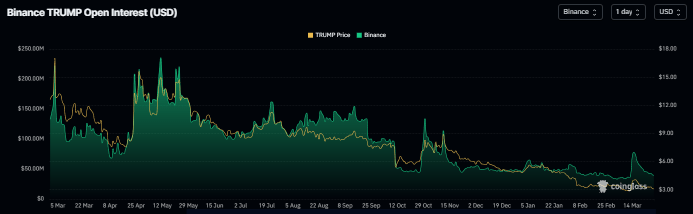
On the derivatives side, metrics show bearish bias. TRUMP’s futures Open Interest (OI) at Binance exchange drops to $39.22 million on Friday and has been steadily falling since mid-March. This drop in OI reflects waning investor participation.
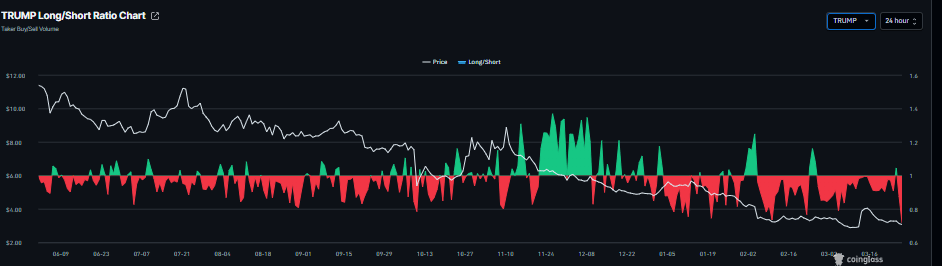
In addition, CoinGlass’s TRUMP’s long-to-short ratio, currently at 0.71 on Friday, is at its lowest level in over a month. This ratio, below one, reflects bearish sentiment in the markets, as more traders are betting on the asset price to fall.
Technical outlook: TRUMP heading toward the year-to-date low
Official Trump meme coin price is extending its correction, slipping below $3.05 as of writing on Friday, continuing its two-week decline streak.
If TRUMP continues its downward trend, it could extend the decline toward the year-to-date low at $2.70. A close below this level could extend losses toward the key psychological level at $2, potentially marking a new yearly low.
The Relative Strength Index (RSI) on the daily chart reads 38, below the neutral level of 50 and points downward, indicating bearish momentum gaining traction. Moreover, the Moving Average Convergence Divergence (MACD) also showed a bearish crossover last week, which remains intact, with rising red histogram bars, further supporting a negative outlook.
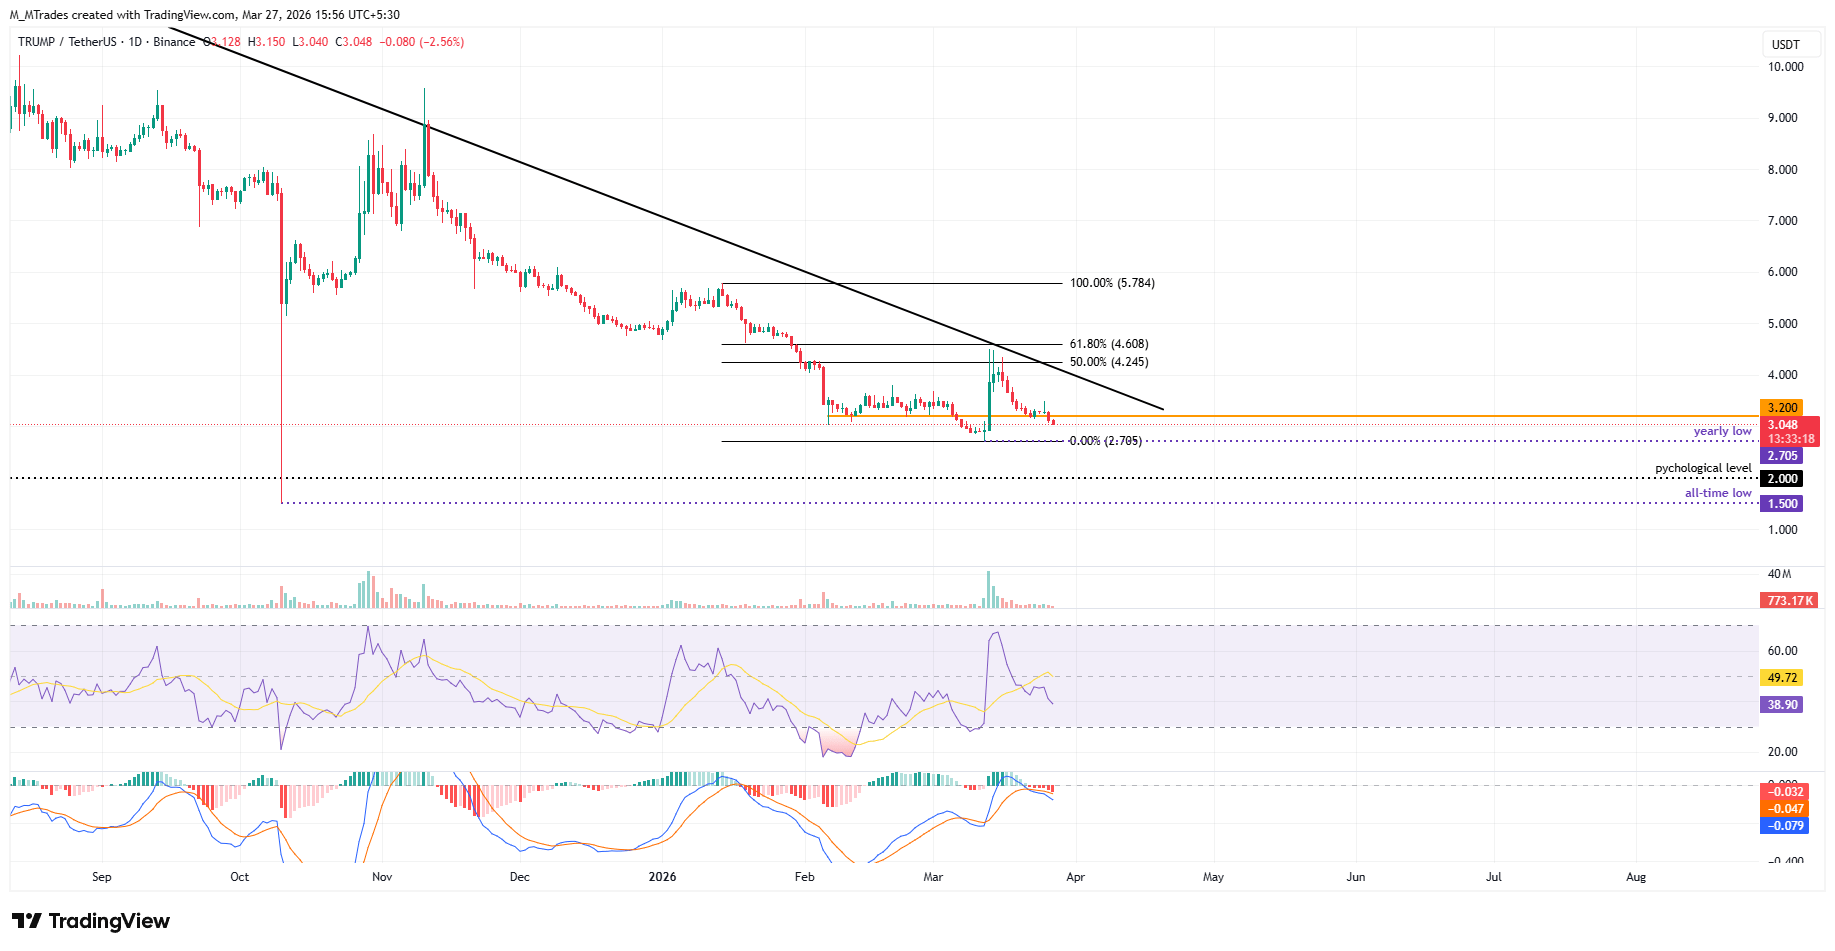
On the contrary, if TRUMP recovers, it could extend the advance toward the daily resistance level at $3.20.
Author

Manish Chhetri
FXStreet
Manish Chhetri is a crypto specialist with over four years of experience in the cryptocurrency industry.



