The wedge pattern I’m watching on Dogecoin
Dogecoin (DOGE) is slightly higher today, trading roughly 1% above yesterday’s price. Not exactly fireworks — but that's kind of the point. After dropping more than 21% from its one-month high, DOGE isn't crashing and it isn't ripping. It's compressing. When I look at the chart, this type of price action immediately tells me the market is still trying to find direction, and that’s where the technicals become especially important.
Before diving deeper into the setup, it’s worth noting the background of Dogecoin. DOGE was originally created as a lighthearted, meme-based cryptocurrency, but over time it has developed a strong and loyal community. What started as a joke has evolved into a widely traded digital asset, often driven by sentiment, social momentum, and broader crypto market trends.
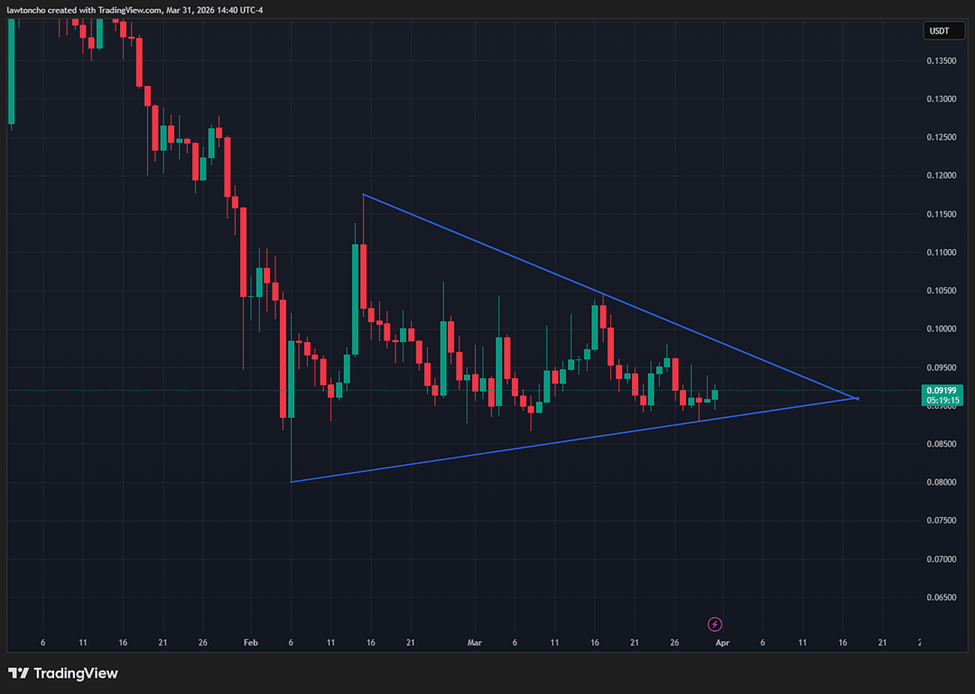
From a technical standpoint, I am focused on a clear wedge pattern forming on the daily chart. The upper trendline of this wedge is established by connecting the highs from February at roughly $0.1175 through the highs formed this month just below $0.105. Each touchpoint reinforces that level as a key area of resistance. At the same time, the lower trendline can be drawn by connecting the lows from last month (at roughly 8 cents) through the lows seen this month, giving us a defined area of support.
As price continues to compress within this structure, the range is tightening, which typically precedes a larger move. This is why I pay close attention to wedge patterns—because the technicals suggest that a breakout is coming, it’s just a matter of direction.
That’s the setup. So what do I do with it?
In terms of strategy, my plan is simple: I look to trade the break of the wedge. If price breaks above the upper trendline, that signals a potential long opportunity. If price breaks below the lower trendline, that opens the door for a short. The version I personally like a little more is waiting for the breakout and then looking for a retrace back to the trendline. That entry tends to feel cleaner and gives you a tighter spot to define your risk.
Speaking of risk — I'll say what I always say, because it's always true: position sizing matters more than being right. DOGE is still a sentiment-driven asset. It can move fast and it can move weird. Know your stop before you enter, not after.
Author

Lawton Ho
Verified Investing
A marketing expert sharing his journey to mastering the charts.



