Solana Price Forecast: SOL shows early signs of recovery despite mixed derivatives sentiment
- Solana extends gains on Monday, marking its fourth consecutive day of recovery.
- Solana derivatives show mixed retail sentiment amid a broader market recovery.
- The technical outlook backs a short-term recovery within a broader declining trend.

Solana (SOL) hovers above $82 at press time on Monday, extending its recovery for the fourth day. A surge in funding rates of SOL futures amid declining Open Interest reflects mixed market sentiment. The technical outlook puts focus on the 50-day Exponential Moving Average (EMA) at $88.80 as the primary resistance.
Institutions stand on the sidelines while derivatives sentiment remains mixed
Solana witnesses a surge in bullish traders’ interest despite a decline in SOL futures Open Interest (OI). CoinGlass data shows the SOL OI-weighted funding rates at 0.0067%, up from 0.0042% on Sunday, indicating a bullish tilt among traders toward holding long positions at a premium. This reflects the market anticipating an. extended recovery in Solana.
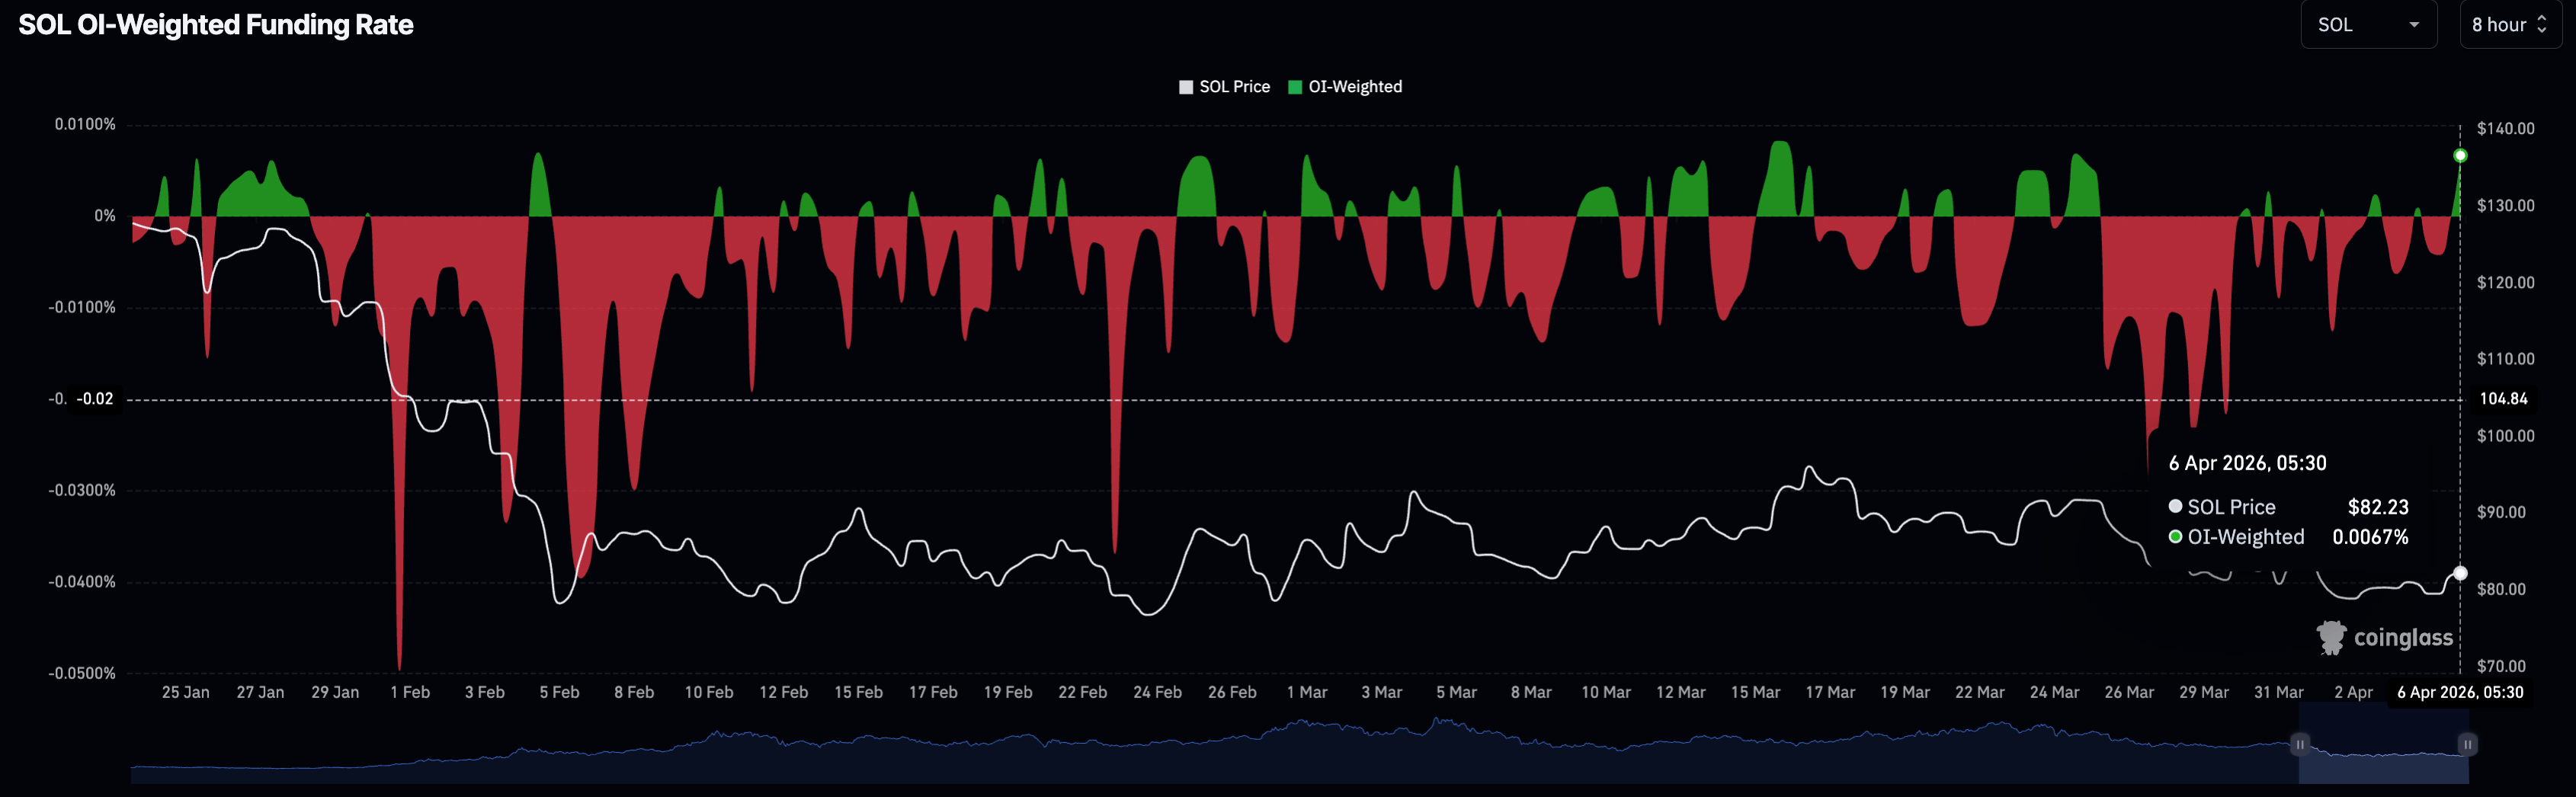
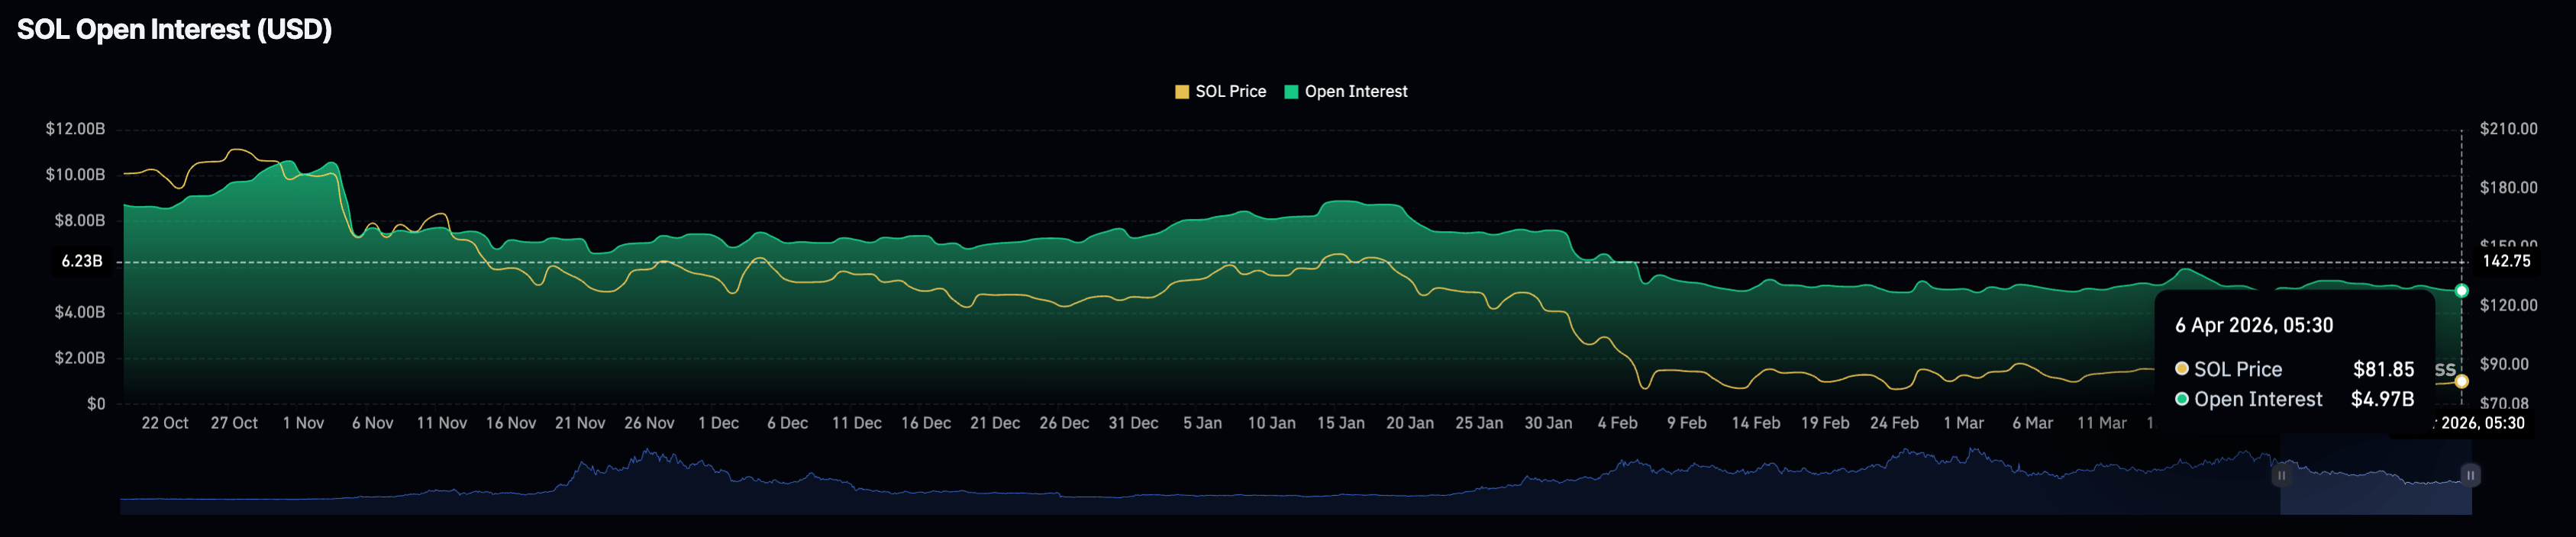
However, the Solana futures OI is at $4.97 billion, down from $5.07 billion on Friday, reflecting a loss in the notional value of outstanding contracts. This reduced risk exposure amid a positive funding rate reflects a mixed market sentiment.
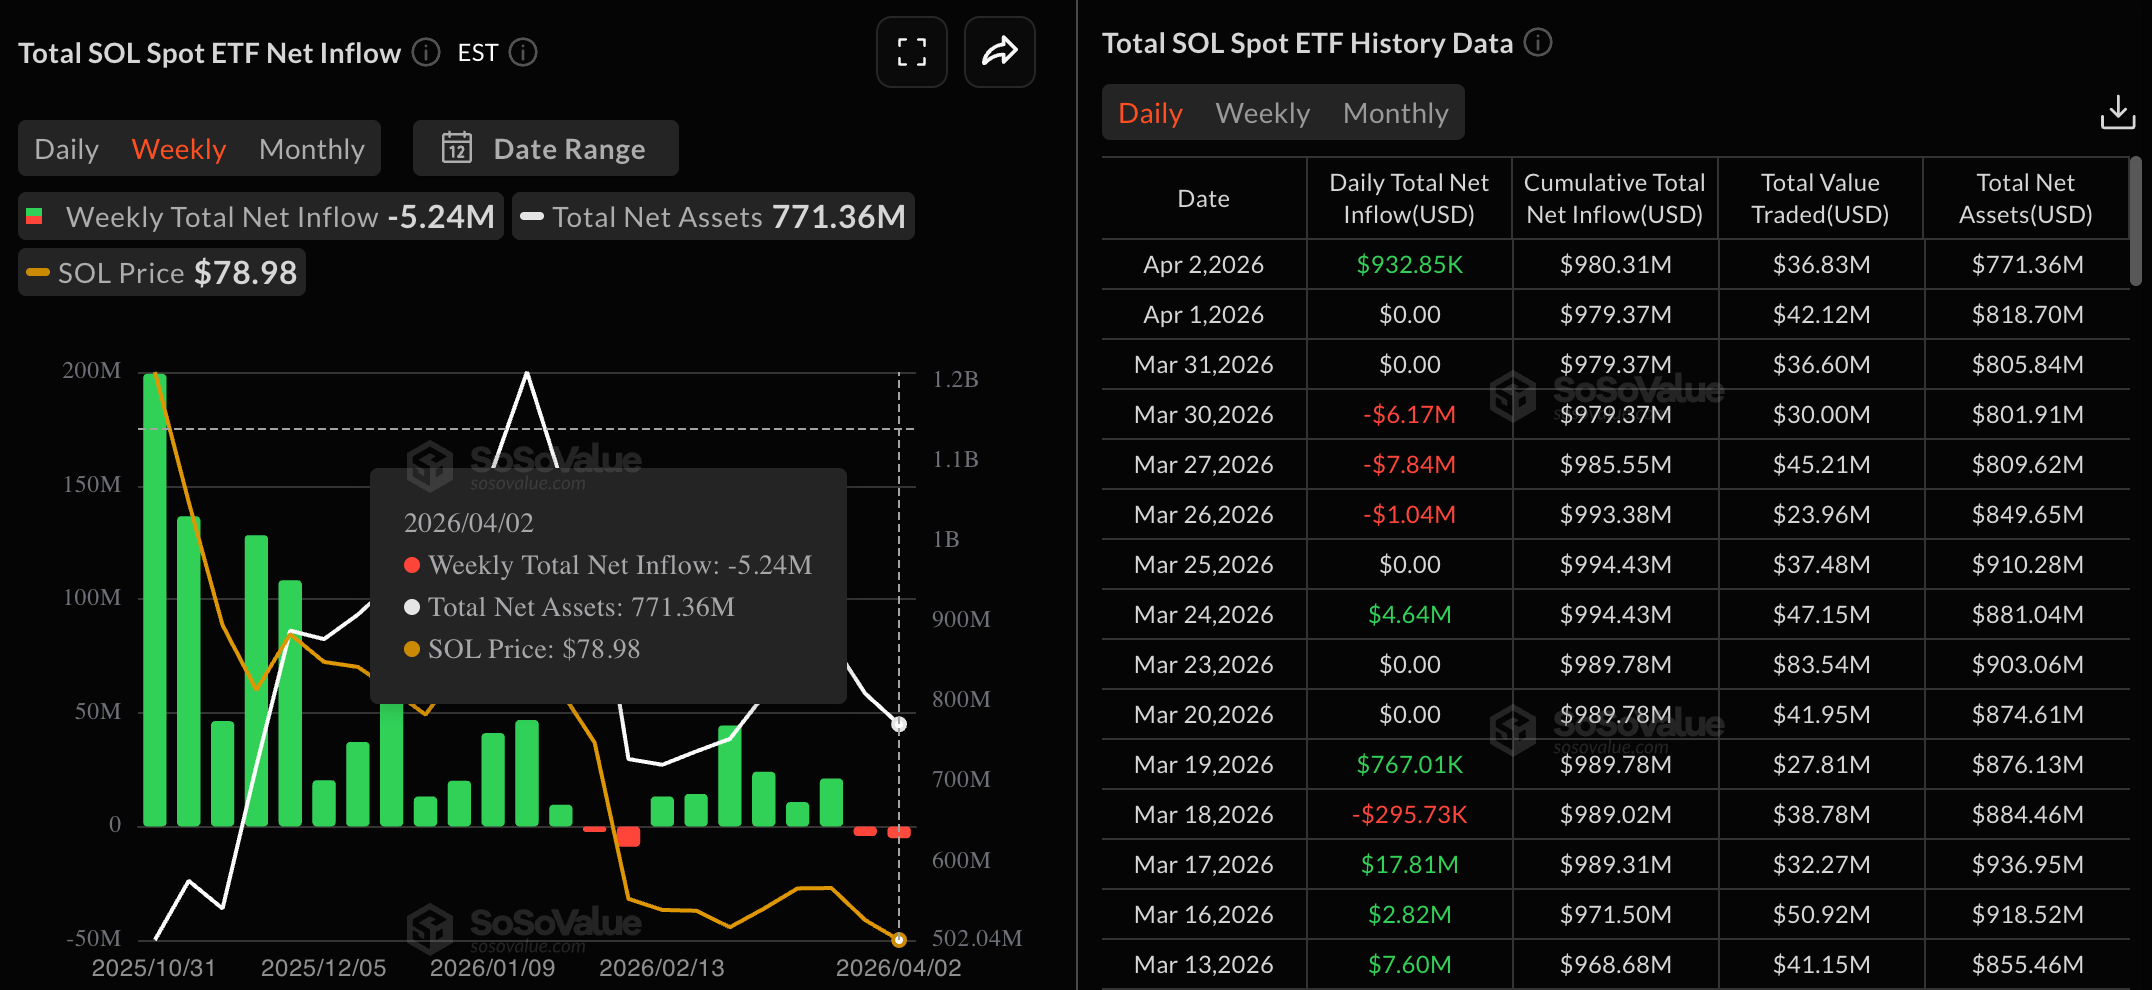
On the other hand, institutional demand for Solana is weak in the near term. Sosovalue data shows the SOL-focused Exchange Traded Funds (ETFs) recorded a net weekly outflow of $5.24 million, marking its second consecutive outflowing week. A consistent outflow this week would mark the longest weekly outflow streak and weigh down the SOL spot market.
Technical outlook: Will Solana extend its recovery to $100?
Solana shows a rebound from the support area near the February 5 low at $77.60 after Thursday's nearly 3% decline. Still, the near-term bias is mixed as SOL holds well below the 50-day and 100-day Exponential Moving Averages, keeping a broader corrective structure.
The Moving Average Convergence Divergence (MACD) line remains below its signal line and below the zero mark, with consistent negative histogram bars signaling persistent selling pressure. The Relative Strength Index (RSI) near 44 remains below the midline, signaling subdued momentum and limiting the scope for a decisive recovery for now.
Immediate resistance emerges at the 50-day EMA near $88.81, which caps rebounds and guards a stronger move toward $98.02, close to the 100-day EMA at $102.18.
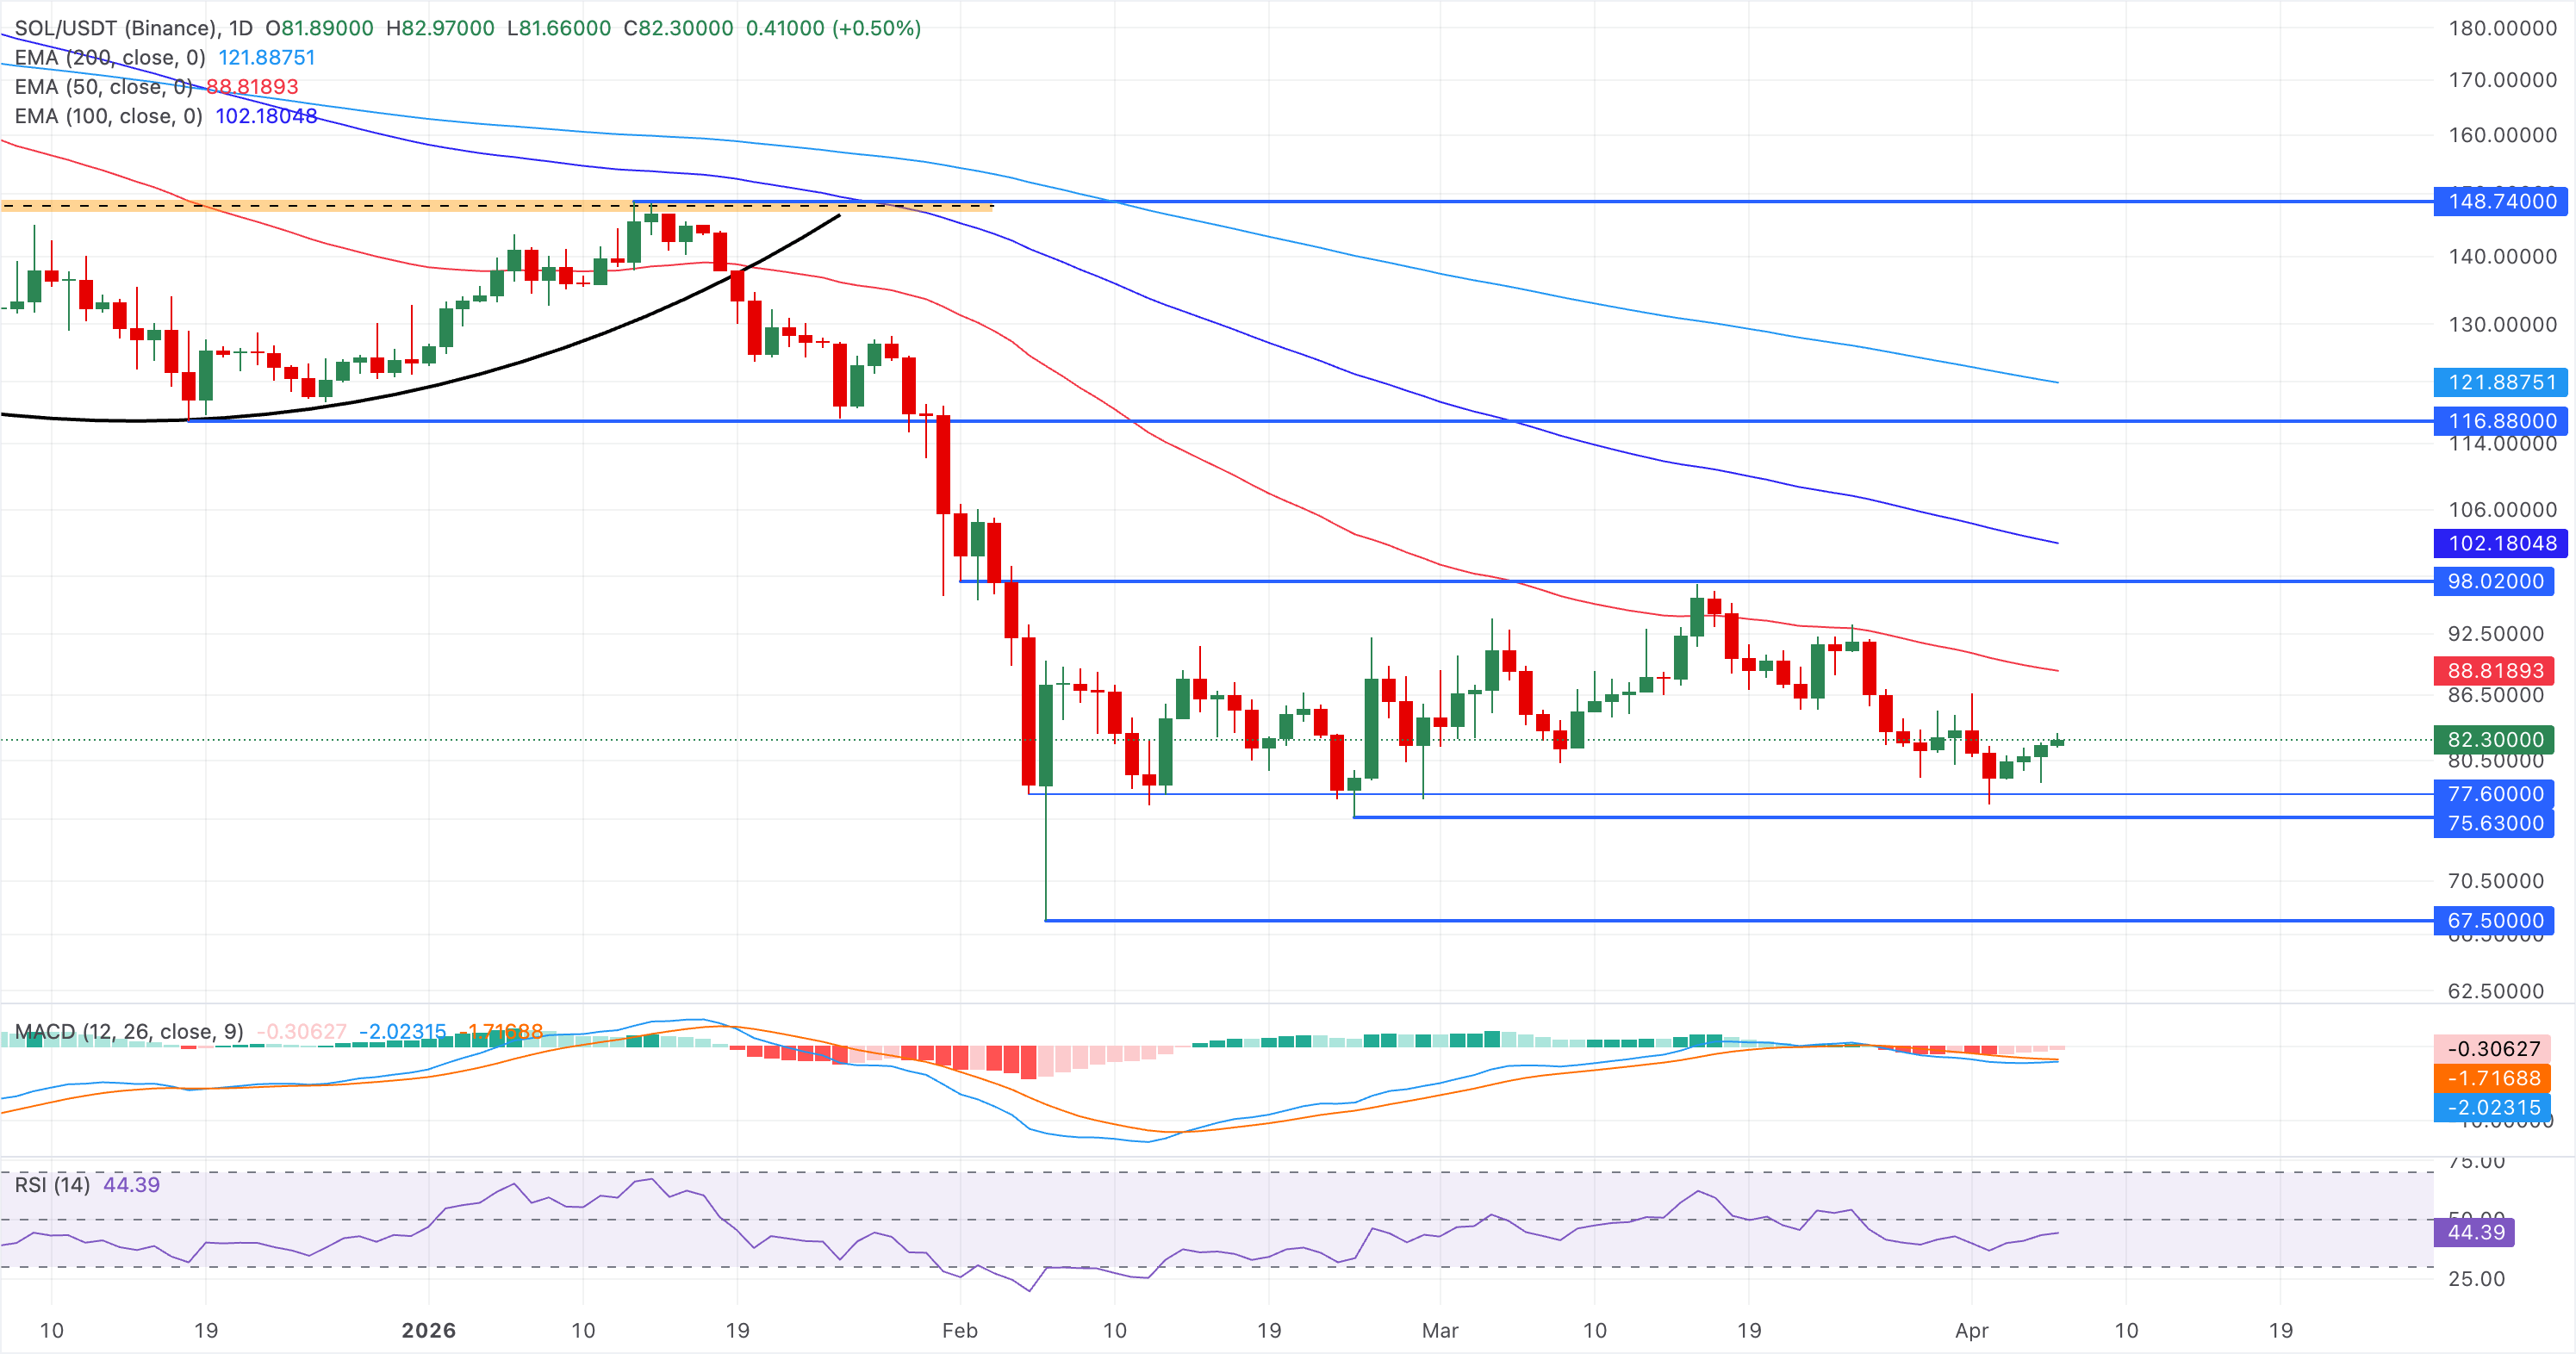
Looking down, the support zone between $75.63 and $77.60 could serve as a bounce-back spot and cap the downside to the February 6 low at $67.50.
(The technical analysis of this story was written with the help of an AI tool.)
Author

Vishal Dixit
FXStreet
Vishal Dixit holds a B.Sc. in Chemistry from Wilson College but found his true calling in the world of crypto.



