Solana Price Forecast: SOL builds momentum, targeting triangle pattern breakout
- Solana edges higher on Monday within a broader triangle pattern, targeting the overhead resistance trendline.
- SOL ETFs recorded a second consecutive weekly inflow, suggesting renewed institutional interest.
- Solana futures suggest increased retail interest as Open Interest and funding rates rise.

Solana (SOL) trades near $88 at press time on Monday, testing grounds above its 50-day Exponential Moving Average (EMA) at $87.04. Renewed weekly inflows in SOL-focused Exchange Traded Funds (ETFs) and rising activity in Solana futures suggest a spike in institutional and retail demand. The technical outlook for Solana is cautiously optimistic, as a short-term recovery could test a triangle breakout.
Institutional and retail demand rise for Solana
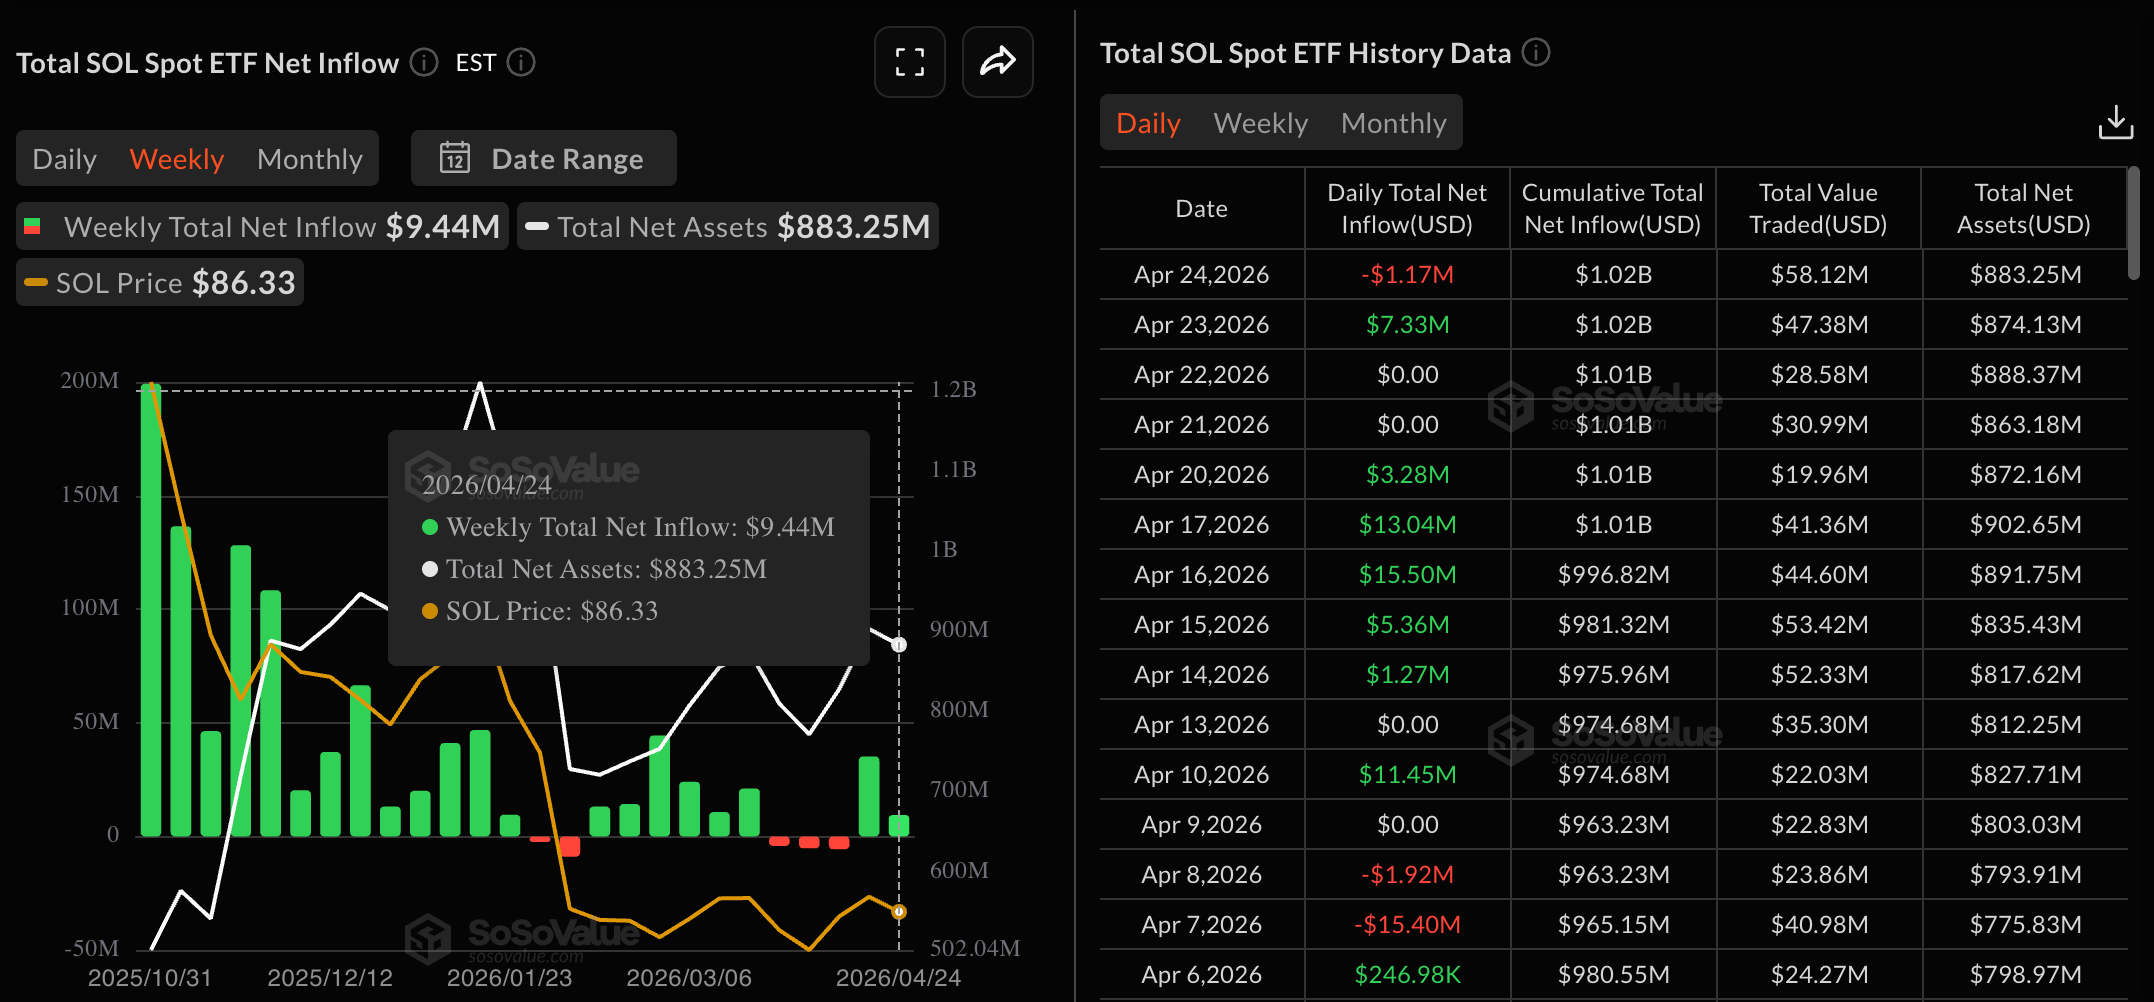
Solana regains institutional and retail support as risk-on sentiment improves across the broader cryptocurrency market, with Bitcoin (BTC) closing near $80,000. SoSoValue data shows Solana ETFs recorded $1.17 million in outflows on Friday, limiting the weekly inflow to $9.44 million, following the previous week’s $35.17 million inflow. The renewed weekly inflows into SOL ETFs imply a resurfacing of institutional support, which could trigger an upside.
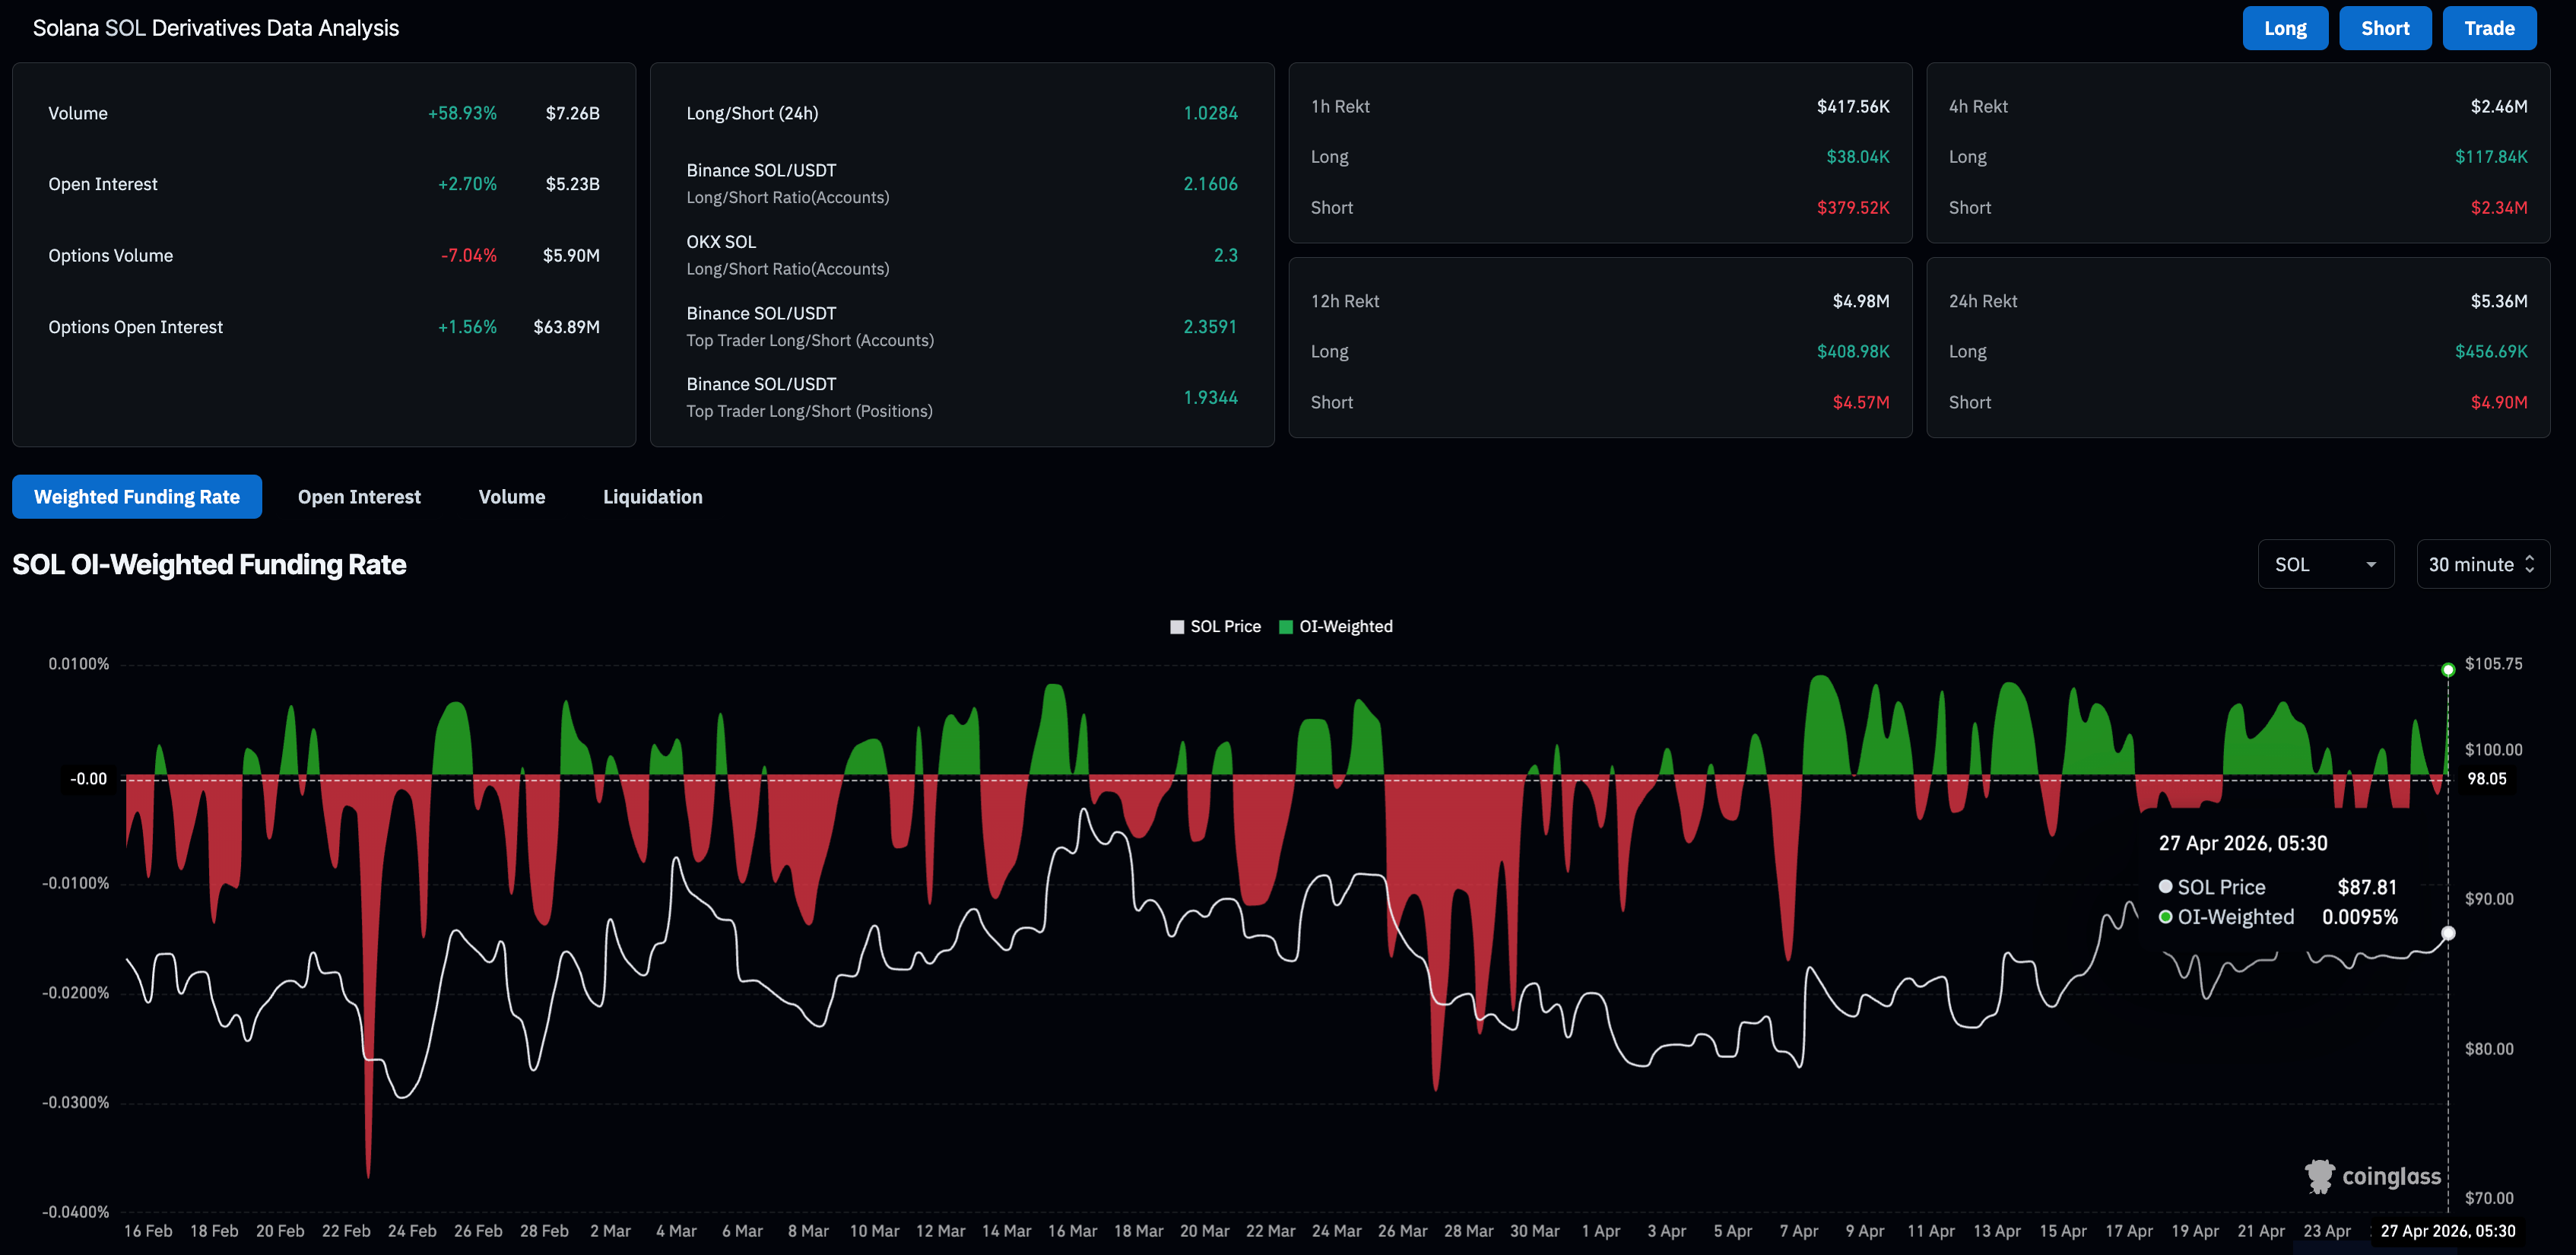
On the derivatives side, CoinGlass data shows that SOL futures Open Interest (OI) is up over 2% in the last 24 hours, reaching $5.23 billion, signaling a positional buildup amid surging trader activity. A spike in the funding rate to 0.0095% indicates a bullish buildup, as buyers are willing to hold long positions at a premium.
Technical outlook: Is Solana ready for a breakout rally?
Solana holds a constructive near-term bias as the intraday gains test ground above the 50-day EMA at $87.04. The recovery approaches the overhead resistance of a symmetrical triangle pattern on the daily chart, near $89.00.
Momentum indicators back this positive tilt, with the Relative Strength Index (RSI) at 55, rising above its midline on the daily chart. At the same time, the Moving Average Convergence Divergence (MACD) and its signal line rise into positive territory, hinting that buyers retain control while upside progress begins to confront nearby trend resistance.
On the topside, initial resistance is defined by the downward-sloping trendline, with a break level around $89.00. A sustained move above this barrier would expose the $100 psychological level, followed by the 200-day EMA at $113.
On the downside, immediate support is provided by the 50-day EMA at $87.04, with the rising trendline near $85.99 as the next line of defense. A daily close below this latter level would weaken the current bullish structure and suggest a deeper corrective phase.
(The technical analysis of this story was written with the help of an AI tool.)
Author

Vishal Dixit
FXStreet
Vishal Dixit holds a B.Sc. in Chemistry from Wilson College but found his true calling in the world of crypto.



