Solana Price Forecast: Market recovery lifts SOL amid muted institutional demand
- Solana extends gains above $85 on Monday, testing a crucial short-term resistance trendline.
- SOL derivatives regain retail strength, with rising bullish bets boosting Open Interest.
- Solana spot ETFs suggest muted institutional demand, with $1.24 million in outflows last week.

Solana (SOL) trades above $85 at press time on Monday, starting the week on a bullish note amid broader market recovery. The rising retail demand is fueling activity in SOL derivatives while institutions remain on the sidelines. Technically, Solana should surpass the 50-day Exponential Moving Average (EMA) around $86, potentially signaling upside toward $100.
Market recovery lifts Solana but lacks institutional support
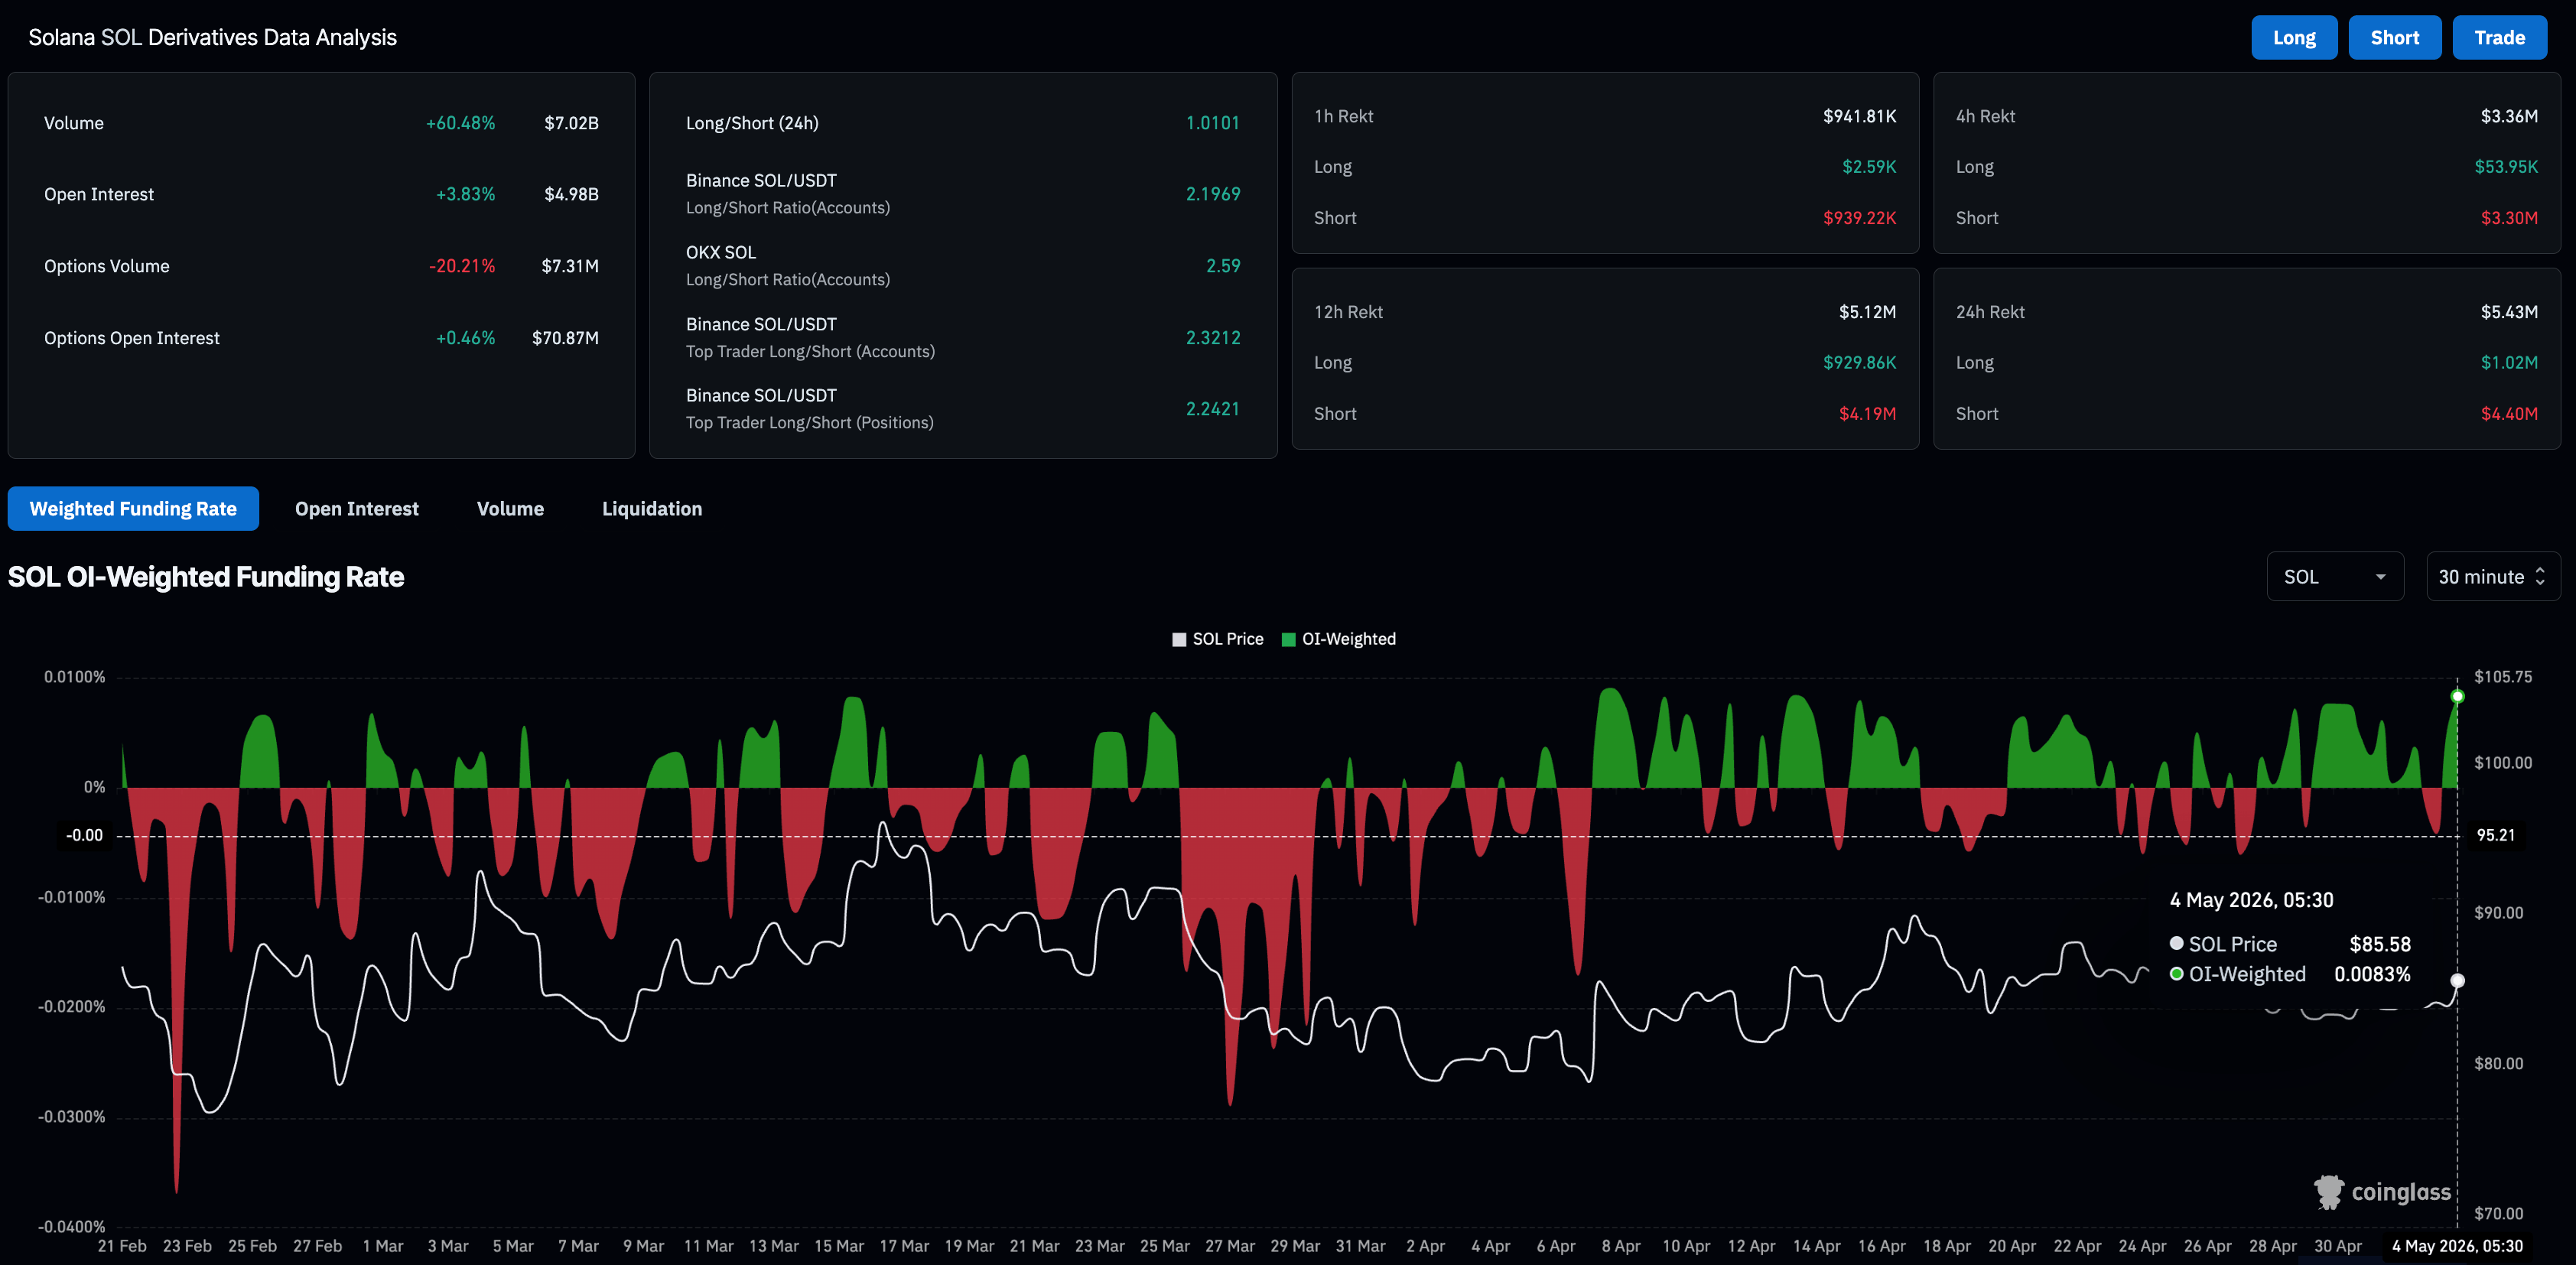
Solana derivatives activity is rising as the broader market recovery improves investors' risk appetite. CoinGlass data shows the SOL futures Open Interest is up roughly 4% over the last 24 hours to $4.98 billion, reflecting renewed positional buildup as risk-on sentiment returns.
In the same time period, liquidations totaled $5.43 million, led by $4.40 million in short liquidations, indicating a buy-side dominance. The OI-weighted funding rate, which remains positive at 0.0083%, reaffirms the buyers’ inclination to hold long positions.
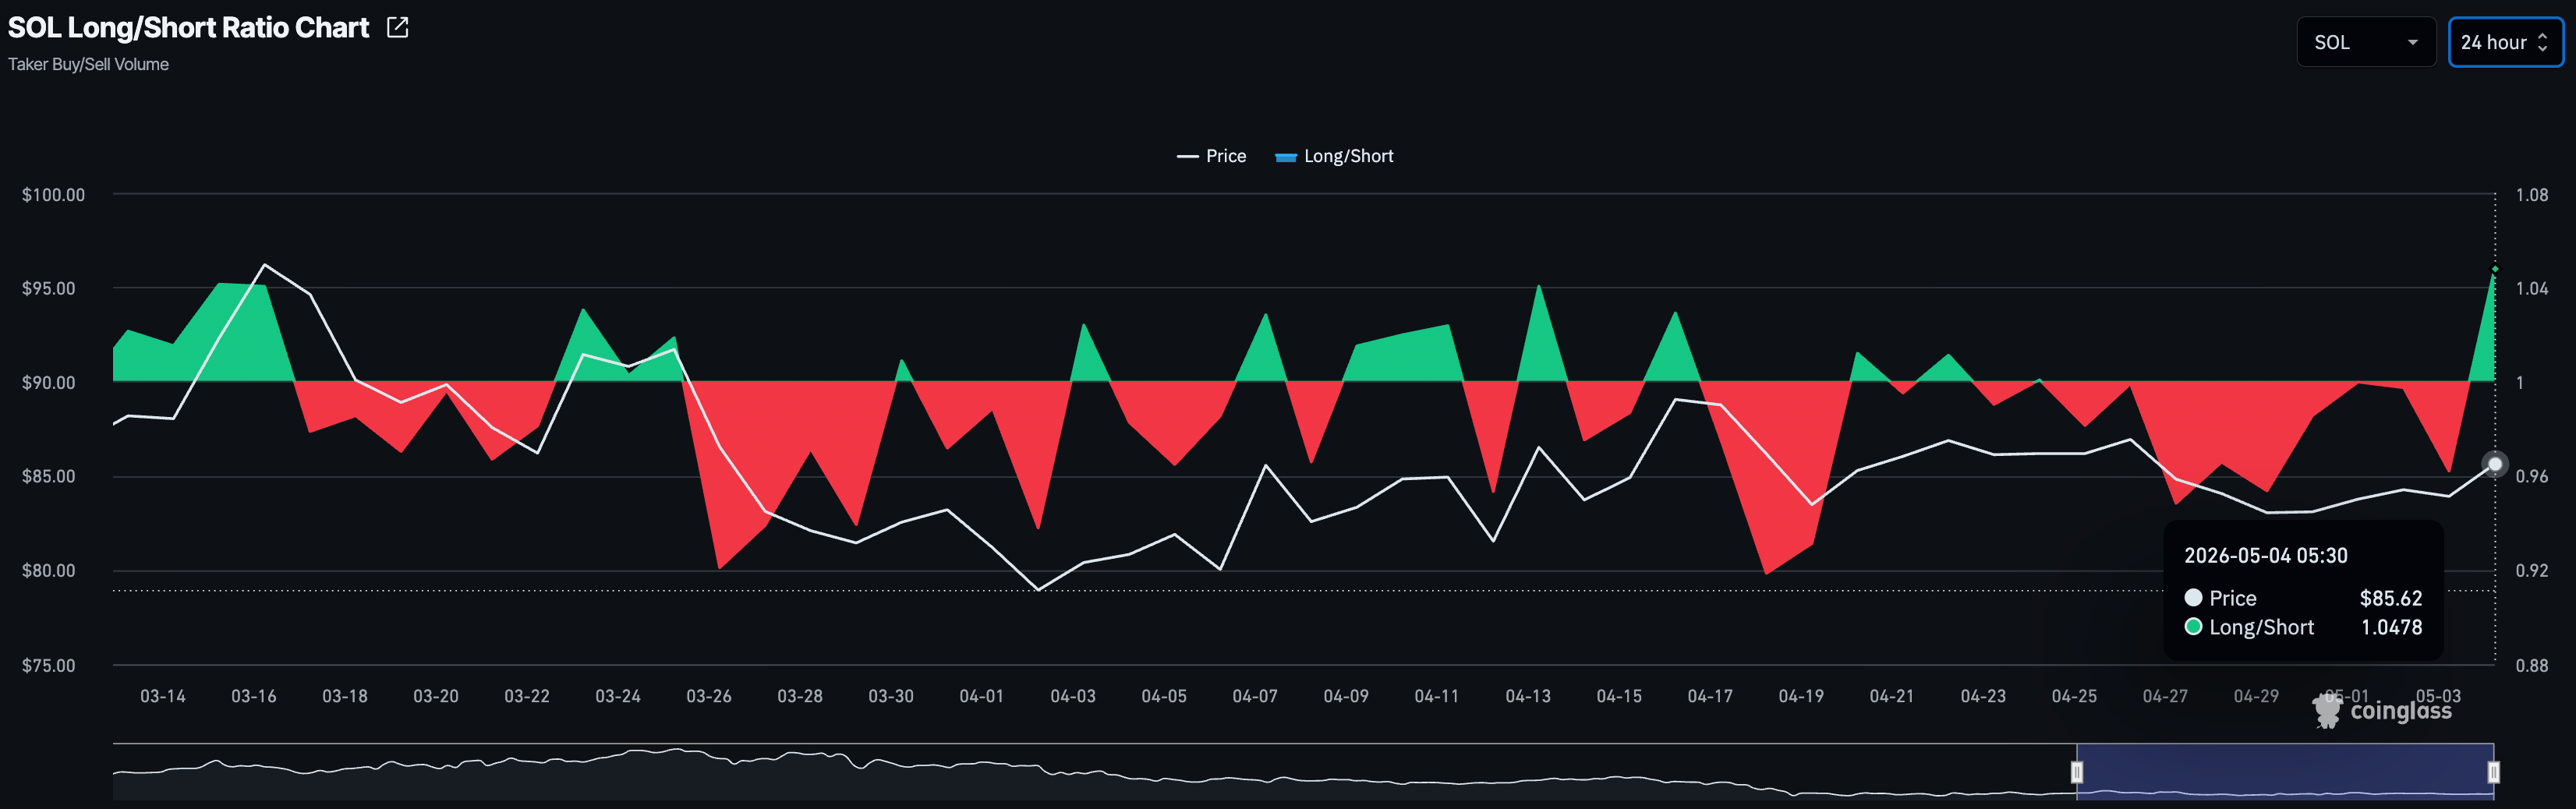
The long-to-short ratio of active SOL positions over the last 24 hours has risen to 1.0478, indicating a greater number of active long positions and confirming upside anticipation among investors.
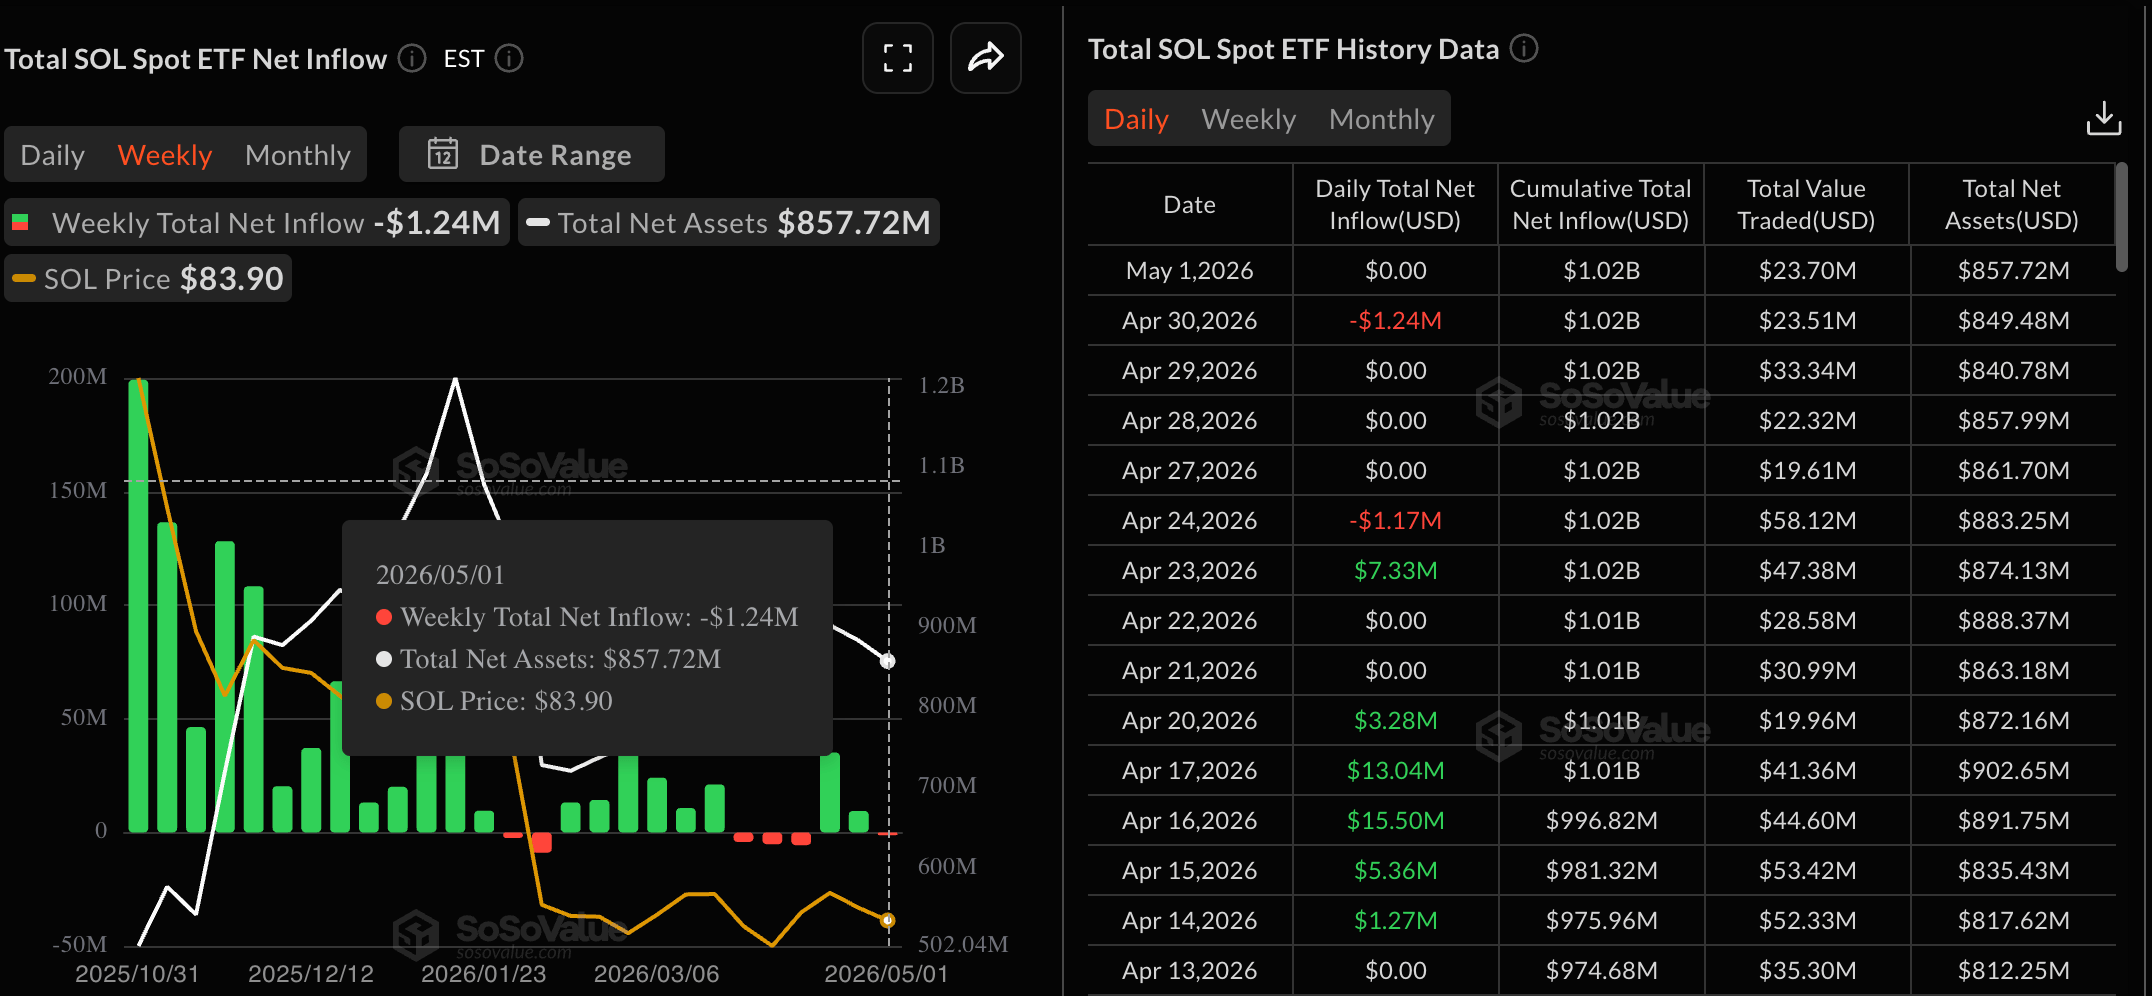
The institutional demand for Solana weakened, with SOL-focused Exchange Traded Funds (ETFs) recording $1.24 million in outflows last week, down from the previous week's inflows of $9.44 million. The lack of institutional support could limit the short-term recovery.
Will Solana rise to $100?
Solana hovers above $85 at press time on Monday, with a cautiously bullish near-term bias as price tests the 50-day EMA at $86.21 and remains well below the 200-day EMA near $111.25. The downward resistance trendline, around $86.65, threatens to cap the short-term recovery.
The Relative Strength Index (RSI) at 52 suggests only modest, balanced momentum. At the same time, the Moving Average Convergence Divergence (MACD) rises toward the signal line as negative histograms contract, suggesting that selling pressure is waning.
On the topside, immediate resistance lies at the 50-day EMA near $86.21, followed by the descending trendline barrier around $86.65, which together define the first supply zone that bulls would need to clear to ease downside pressure.
If SOL fails to reclaim the 50-day EMA at $86.21, it could reverse to the downside, targeting the February 24 low at $75.63.
(The technical analysis of this story was written with the help of an AI tool.)
Author

Vishal Dixit
FXStreet
Vishal Dixit holds a B.Sc. in Chemistry from Wilson College but found his true calling in the world of crypto.



