Solana Price Forecast: Institutional demand rises as SOL floats above $80
- Solana hovers above $80 on Monday, extending a lateral move as the broader market consolidates.
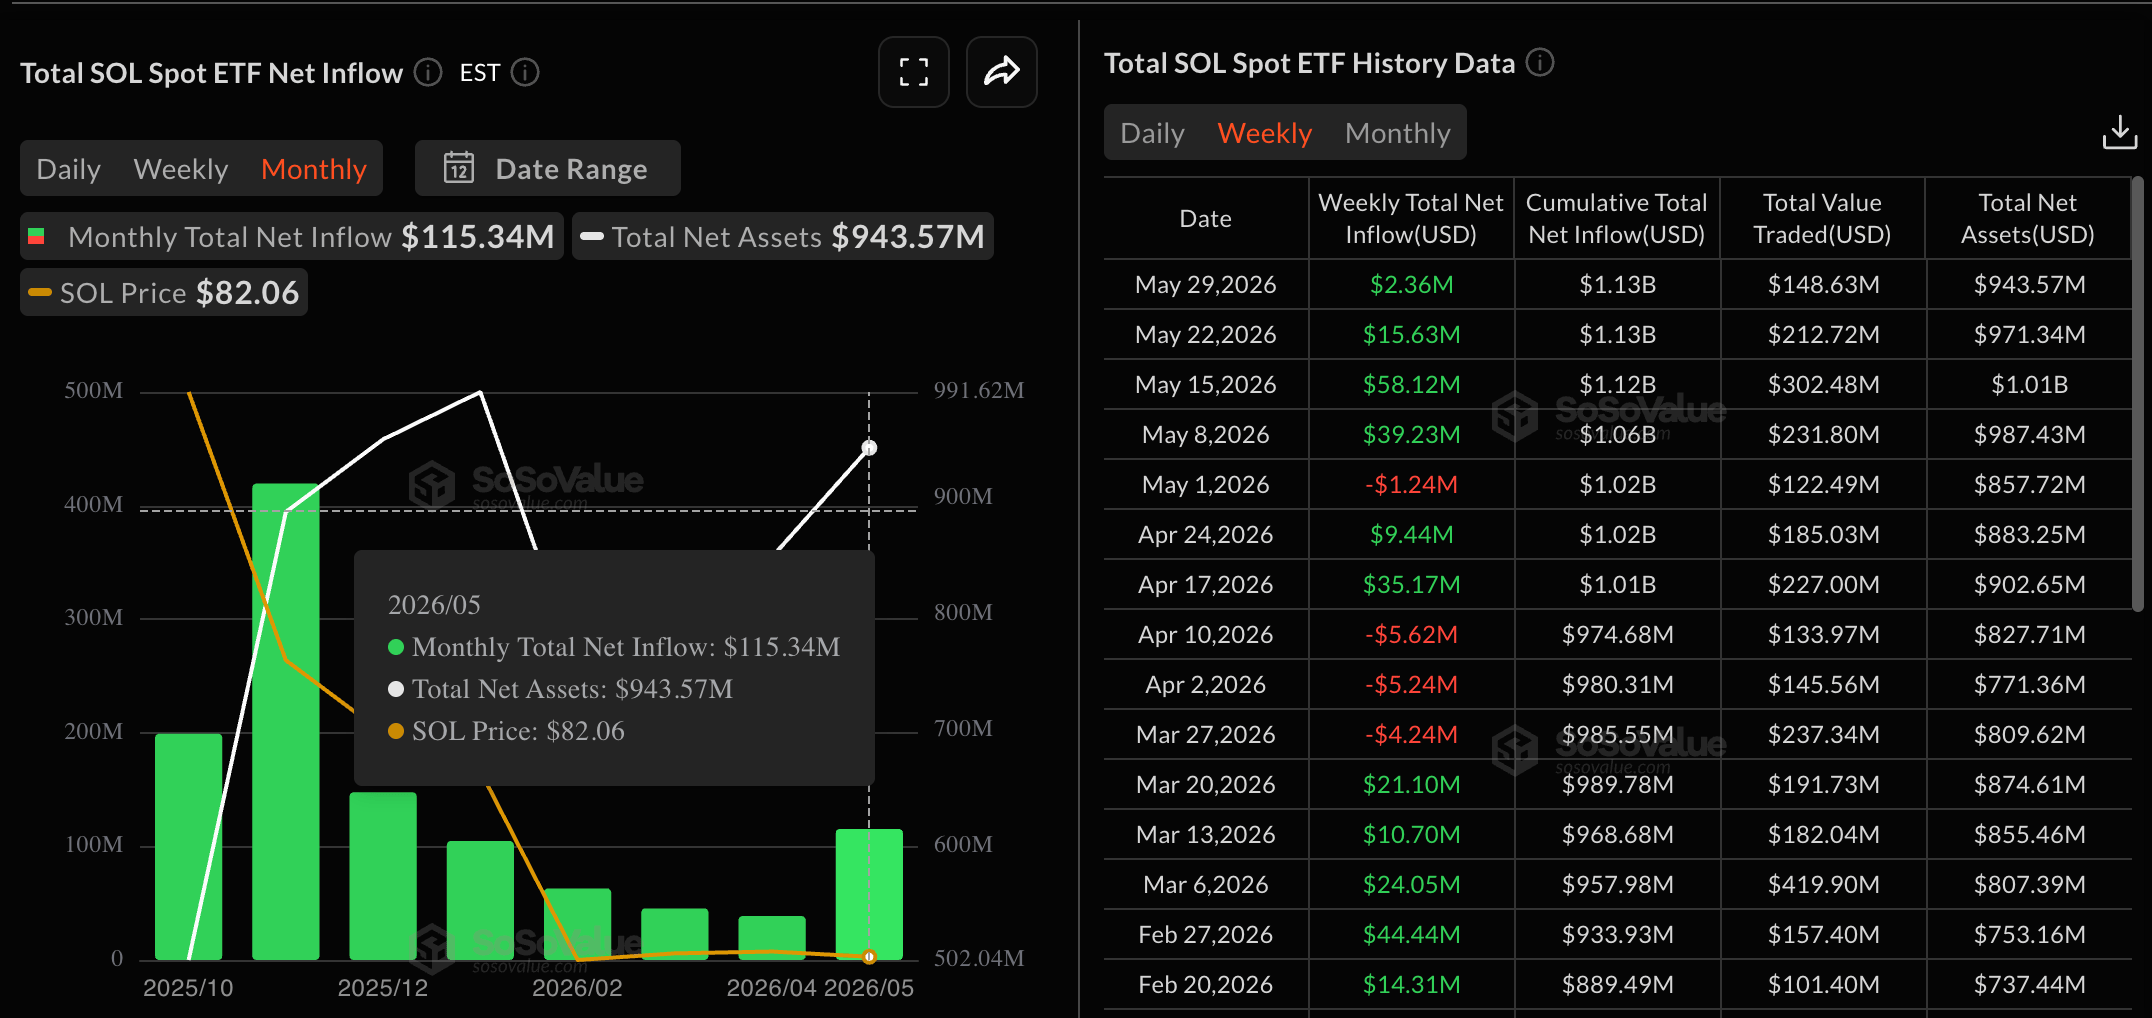
- SOL-focused ETFs recorded over $115 million in inflows last month, suggesting renewed institutional demand.
- A surge in SOL futures funding rate shows early signs of retail demand.

Solana (SOL) floats above $80 at press time on Monday, avoiding deeper corrections with rebounds to extend a consolidating move. The rising institutional demand, with over $115 million in inflows last month, and a surge in tokenized Real World Assets (RWAs) on Solana, reflect strong foundational demand for the long term. Still, the rise in retail demand with increasing funding rates fails to liberate SOL from prevailing downside pressure.
Institutions shift focus to Solana
Solana ETFs are gaining momentum, while Bitcoin ETFs have recorded three consecutive weekly outflows of over $1 billion, suggesting that institutions are willing to hold altcoins over the King Crypto. SoSoValue data shows Solana ETFs recorded their fourth consecutive weekly inflow of $2.36 million, bringing the total monthly inflow to $115.34 million, extending the streak of positive monthly flows since their inception in October.
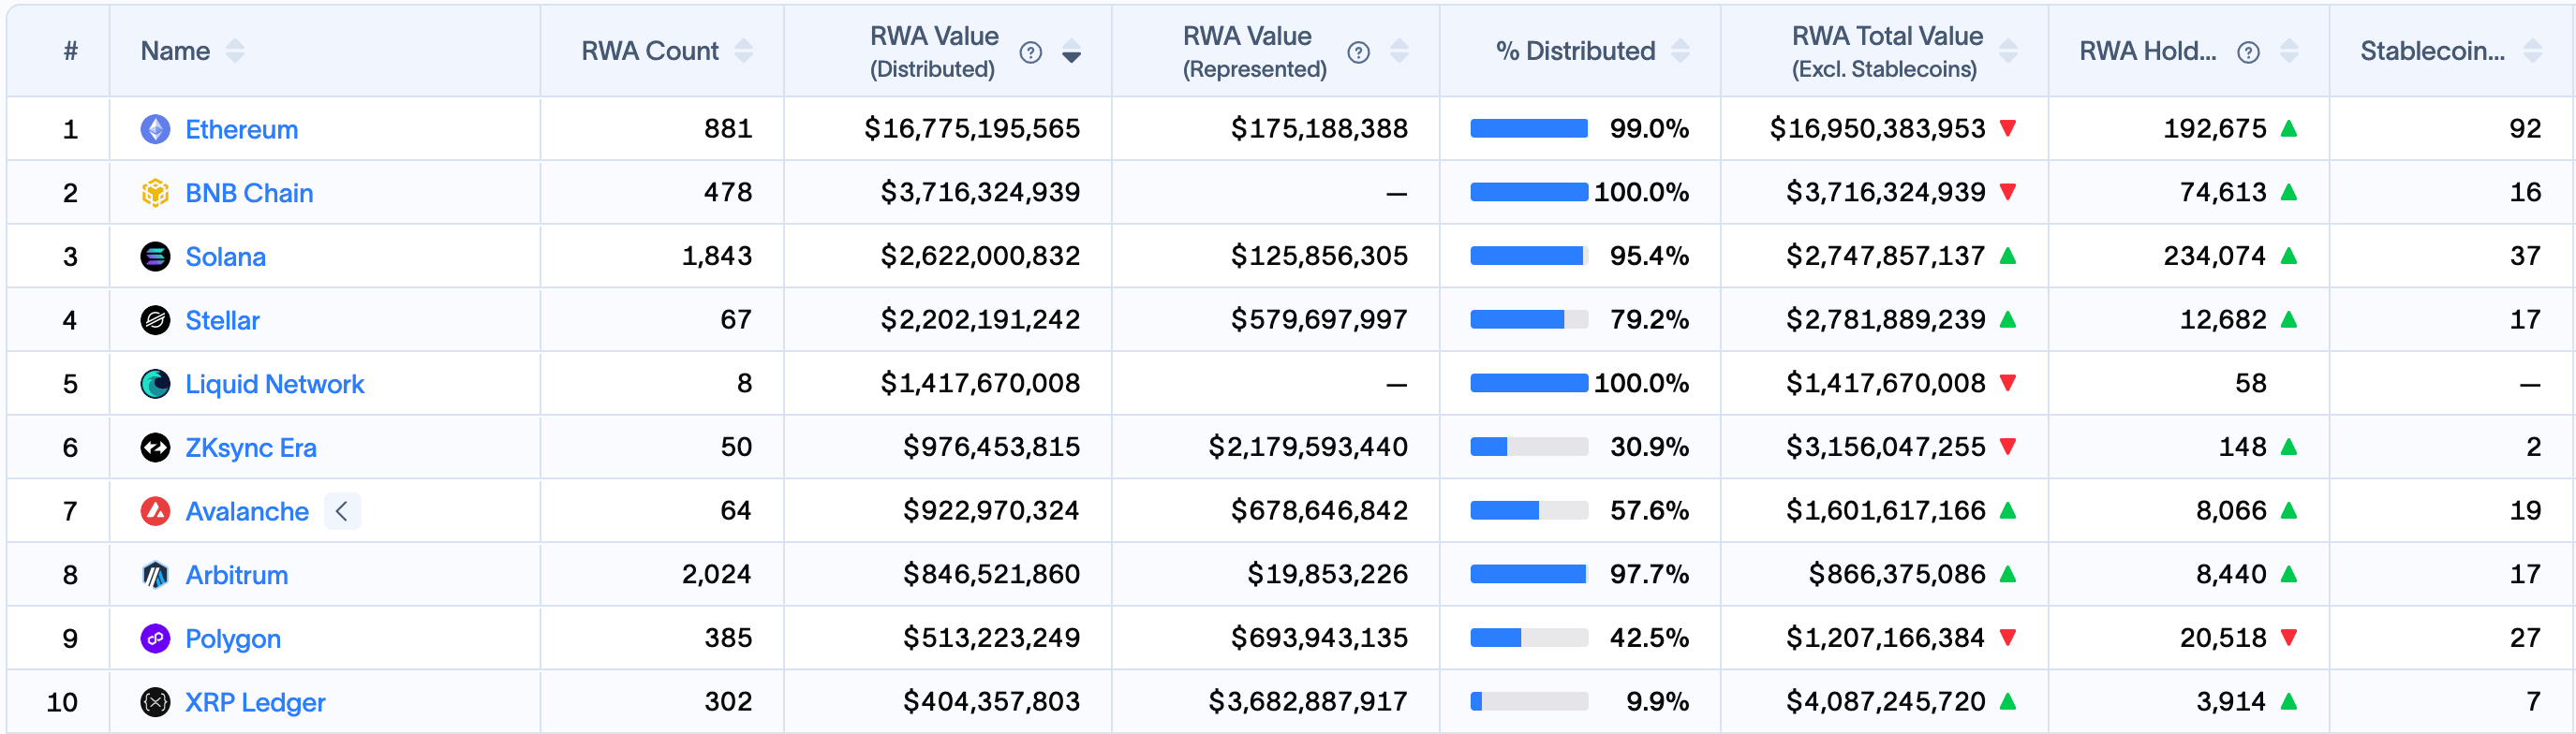
At the same time, Solana is expanding its footprint in the tokenized RWAs sector, which emerges as one of the leading growth stories in the crypto market. Solana ranks as the third-largest RWA network with $2.74 billion of tokenized assets, after Ethereum and the BNB chain.
A steady demand for Solana among deep-pocketed investors amid its growing real-world utility positions it well for the long term.
Retail interest leans bullish despite sluggish price movement
Solana shows signs of recovery in retail interest as price holds above the $80 mark. CoinGlass data show that SOL Open Interest (OI) has remained stable at around $5.37 billion over the last 24 hours, while the OI funding rate remains positive at 0.0093%. This reflects stability in the notional value of outstanding contracts, while long position holders are willing to pay a premium to offset the spot-swap price difference, as they anticipate an upside move.
On the other hand, the liquidation data show mixed results, with $4.02 million in total liquidation over the last 24 hours, led by $3.24 million in long positions, suggesting sell-side dominance.
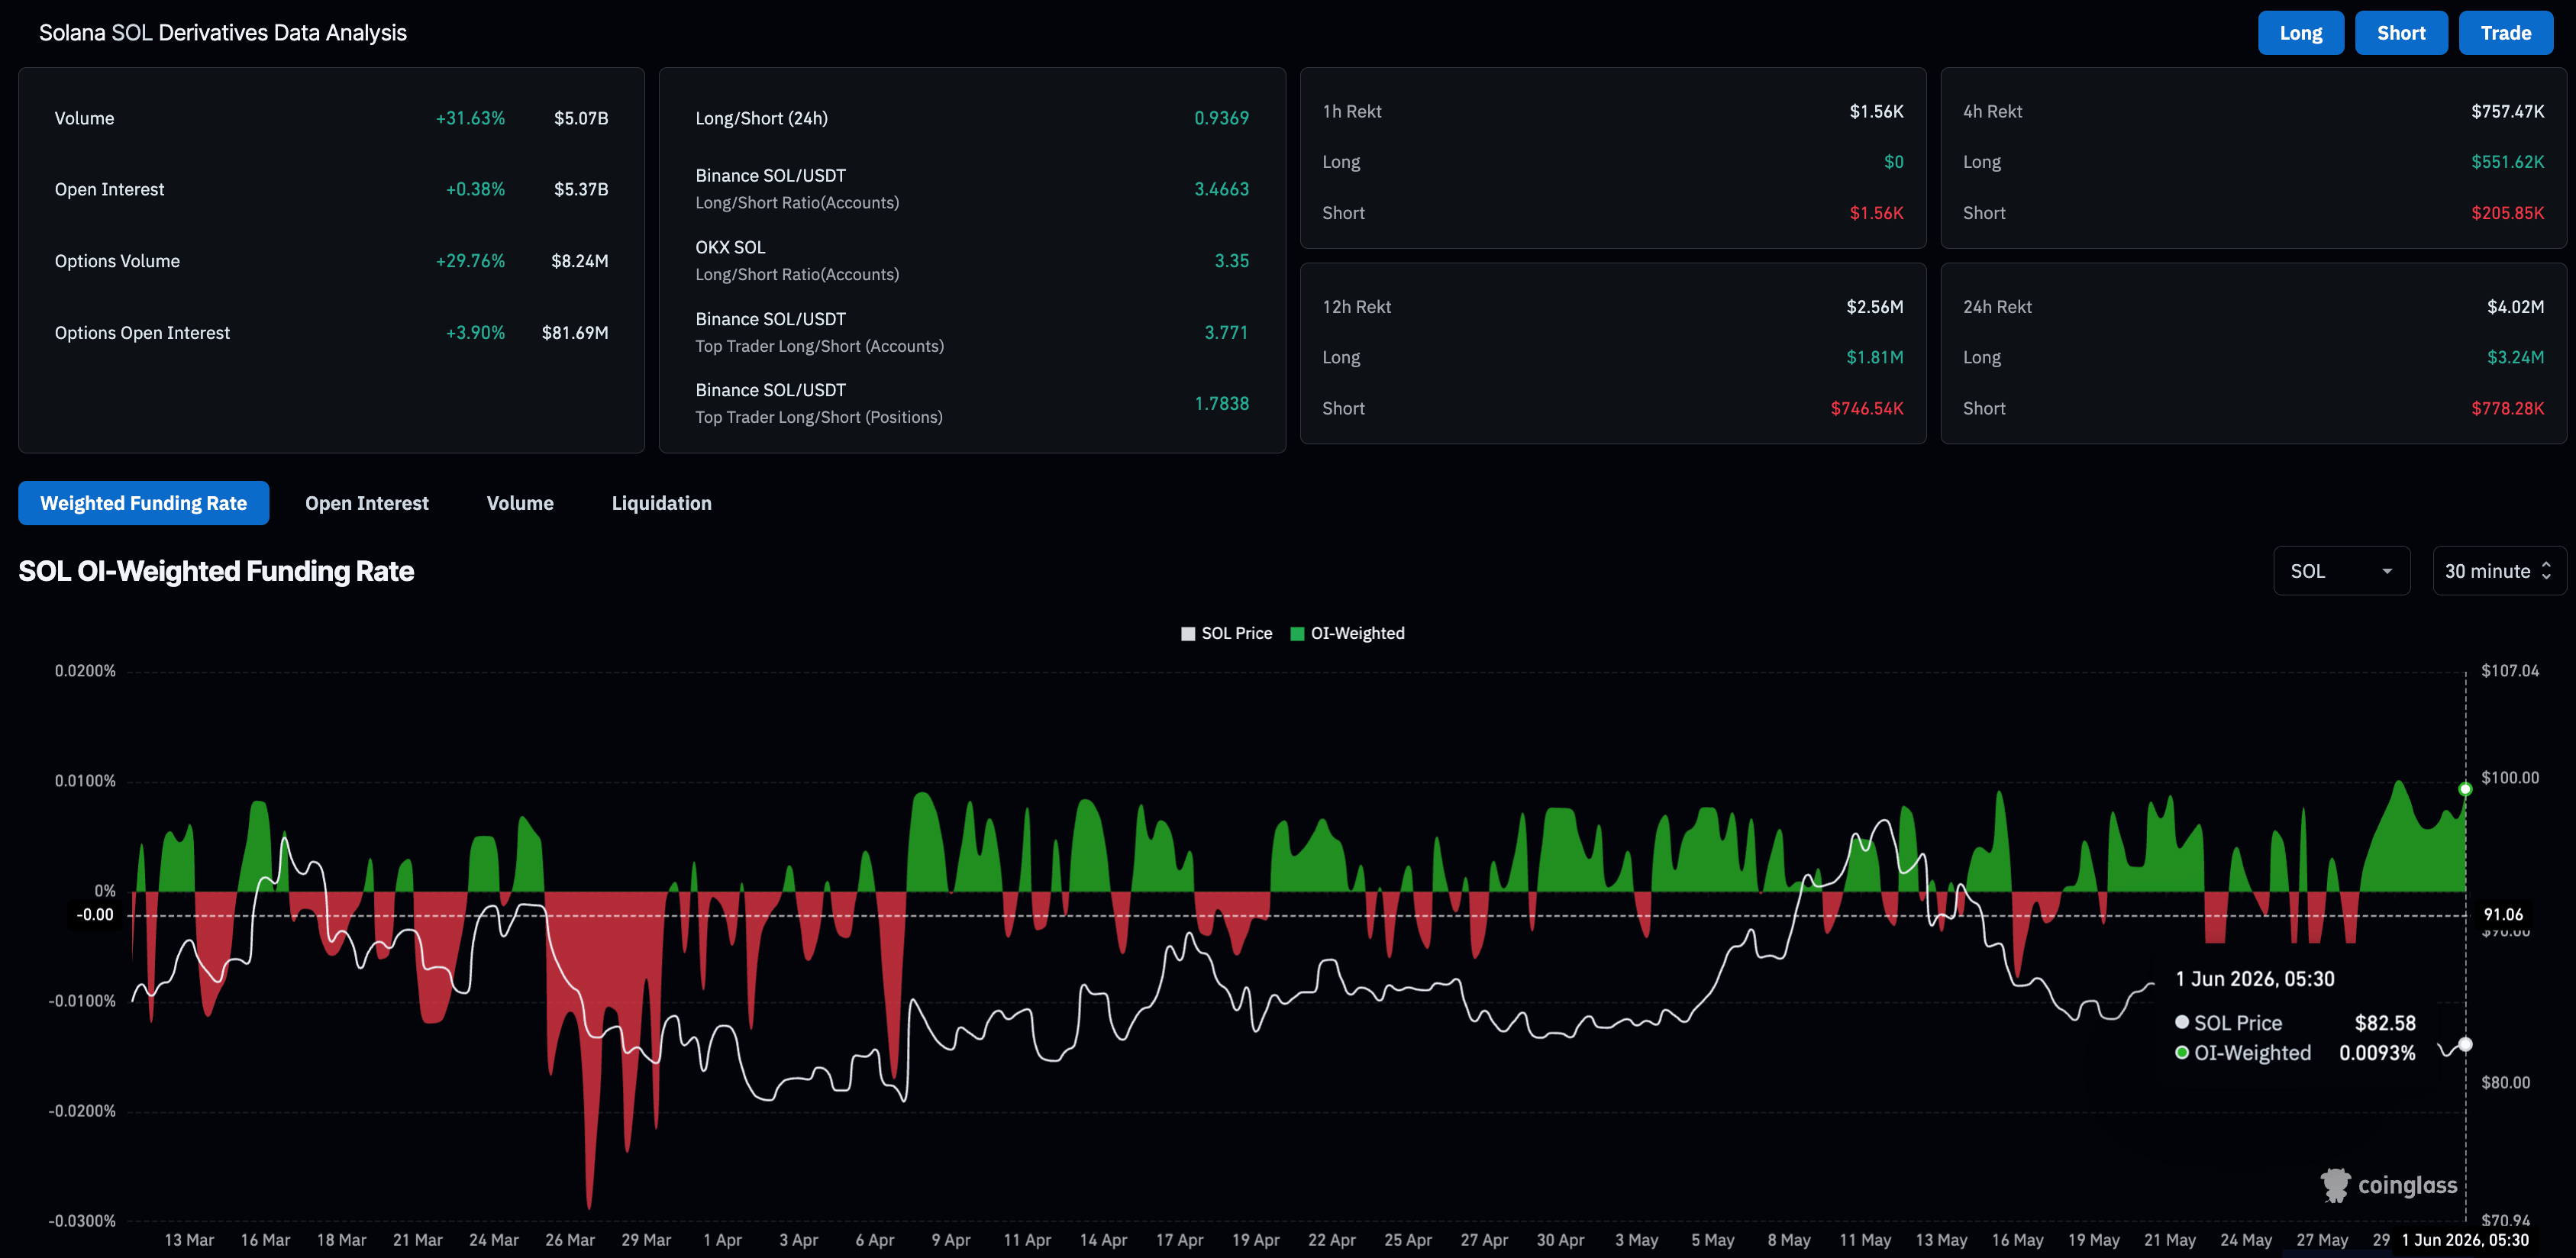
Given that the price remains volatile around $80, long-position holders remain at risk of forced liquidation, keeping short-term retail support fragile.
Could Solana rebound to $100?
Solana extends a sideways movement above Thursday's low of $80.00 and the support-turned-resistance of the May 17 low at $83.50. SOL maintains a bearish near-term bias as price remains below the 50-, 100-, and 200-day Exponential Moving Averages (EMAs), clustered between roughly $86 and $108.
The Relative Strength Index (RSI) at 41 on the daily chart stabilizes between the midline and the oversold zone, suggesting a cooldown in the prevailing downside pressure. Meanwhile, the Moving Average Convergence Divergence (MACD) remains below zero but approaches its signal line as negative histograms contract, reinforcing that downside pressure is losing intensity.
A daily close above $83.50 would pave the path toward the overhead barriers at the 50- and 100-day EMAs at $86.16 and $91.62, respectively. Beyond this zone, the February 1 low at $98.02 remains a key resistance level that capped the rebounds in March and May. If Solana clears this level, the 200-day EMA at $108.14 would serve as the next crucial barrier, reflecting the long-term declining trend.
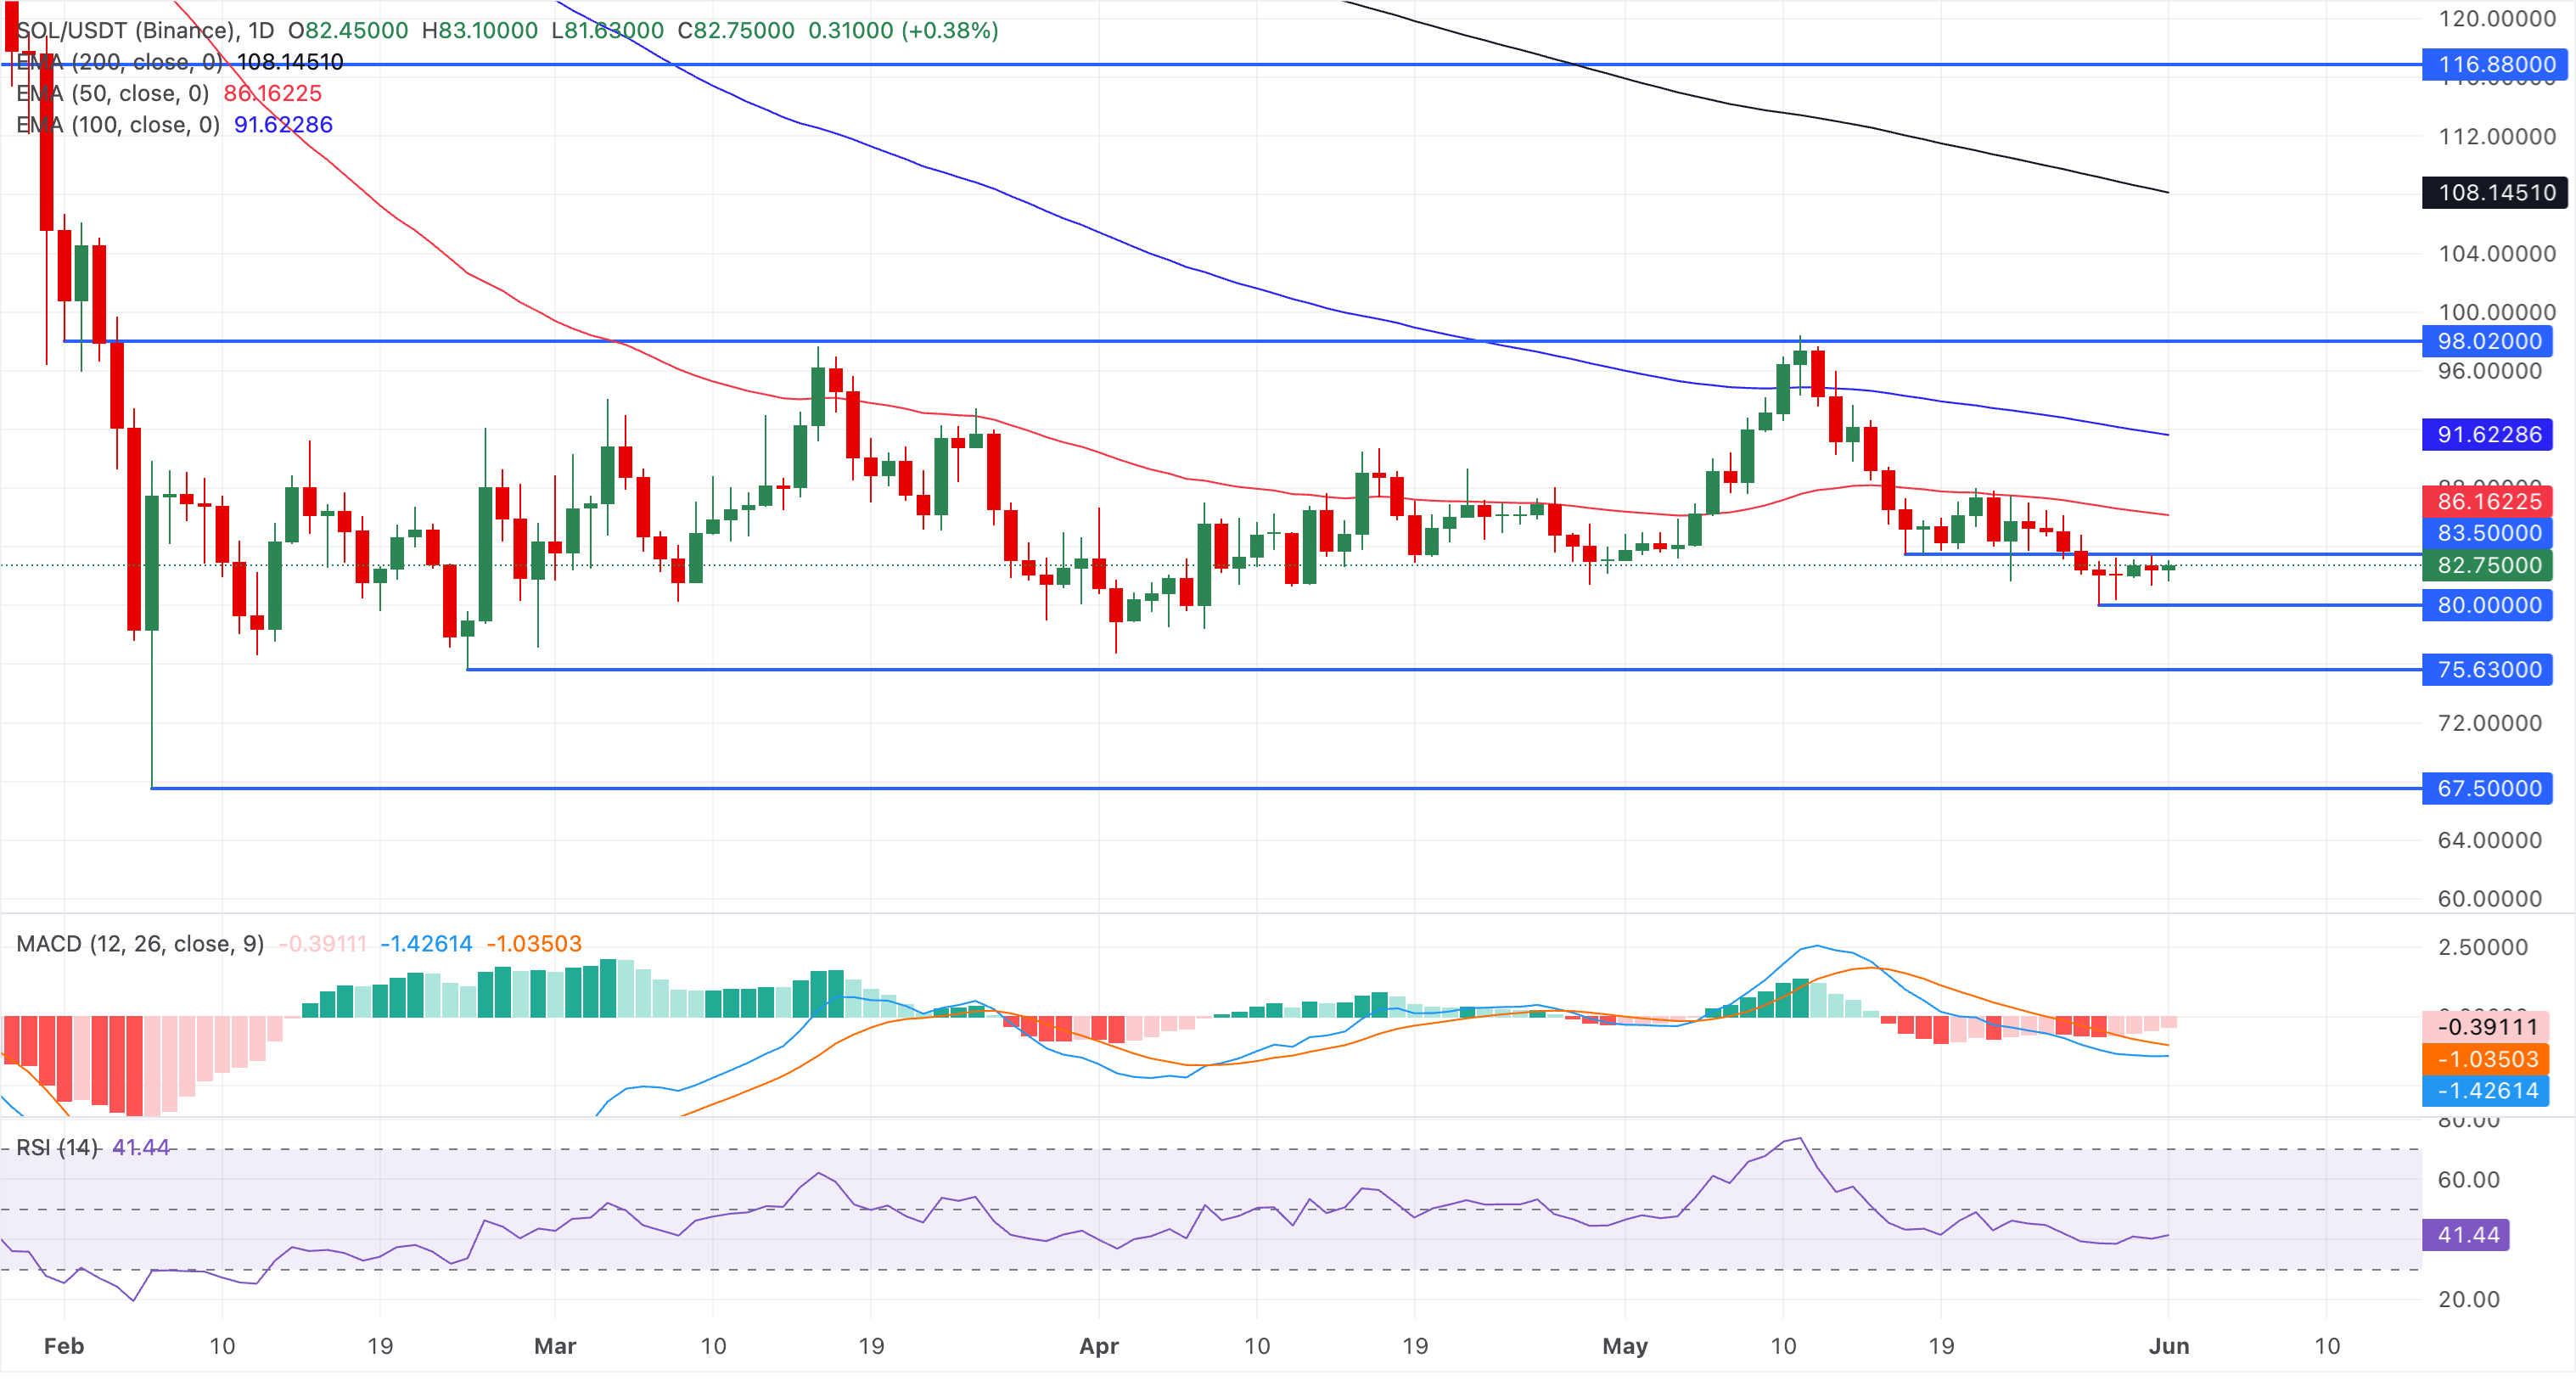
Looking down, a break below $80.00 could significantly increase bearish pressure on the February 24 and February 6 lows at $75.63 and $67.50, respectively, serving as the next-in-line support levels.
(The technical analysis of this story was written with the help of an AI tool.)
(This story was corrected on June 01 at 06:10 GMT to remove a URL link from the first heading.)
Cryptocurrency metrics FAQs
The developer or creator of each cryptocurrency decides on the total number of tokens that can be minted or issued. Only a certain number of these assets can be minted by mining, staking or other mechanisms. This is defined by the algorithm of the underlying blockchain technology. On the other hand, circulating supply can also be decreased via actions such as burning tokens, or mistakenly sending assets to addresses of other incompatible blockchains.
Market capitalization is the result of multiplying the circulating supply of a certain asset by the asset’s current market value.
Trading volume refers to the total number of tokens for a specific asset that has been transacted or exchanged between buyers and sellers within set trading hours, for example, 24 hours. It is used to gauge market sentiment, this metric combines all volumes on centralized exchanges and decentralized exchanges. Increasing trading volume often denotes the demand for a certain asset as more people are buying and selling the cryptocurrency.
Funding rates are a concept designed to encourage traders to take positions and ensure perpetual contract prices match spot markets. It defines a mechanism by exchanges to ensure that future prices and index prices periodic payments regularly converge. When the funding rate is positive, the price of the perpetual contract is higher than the mark price. This means traders who are bullish and have opened long positions pay traders who are in short positions. On the other hand, a negative funding rate means perpetual prices are below the mark price, and hence traders with short positions pay traders who have opened long positions.
Author

Vishal Dixit
FXStreet
Vishal Dixit holds a B.Sc. in Chemistry from Wilson College but found his true calling in the world of crypto.




