Solana Price Forecast: Downside pressure builds amid fading momentum
- Solana held above $80 on Monday after a 4% decline the previous day.
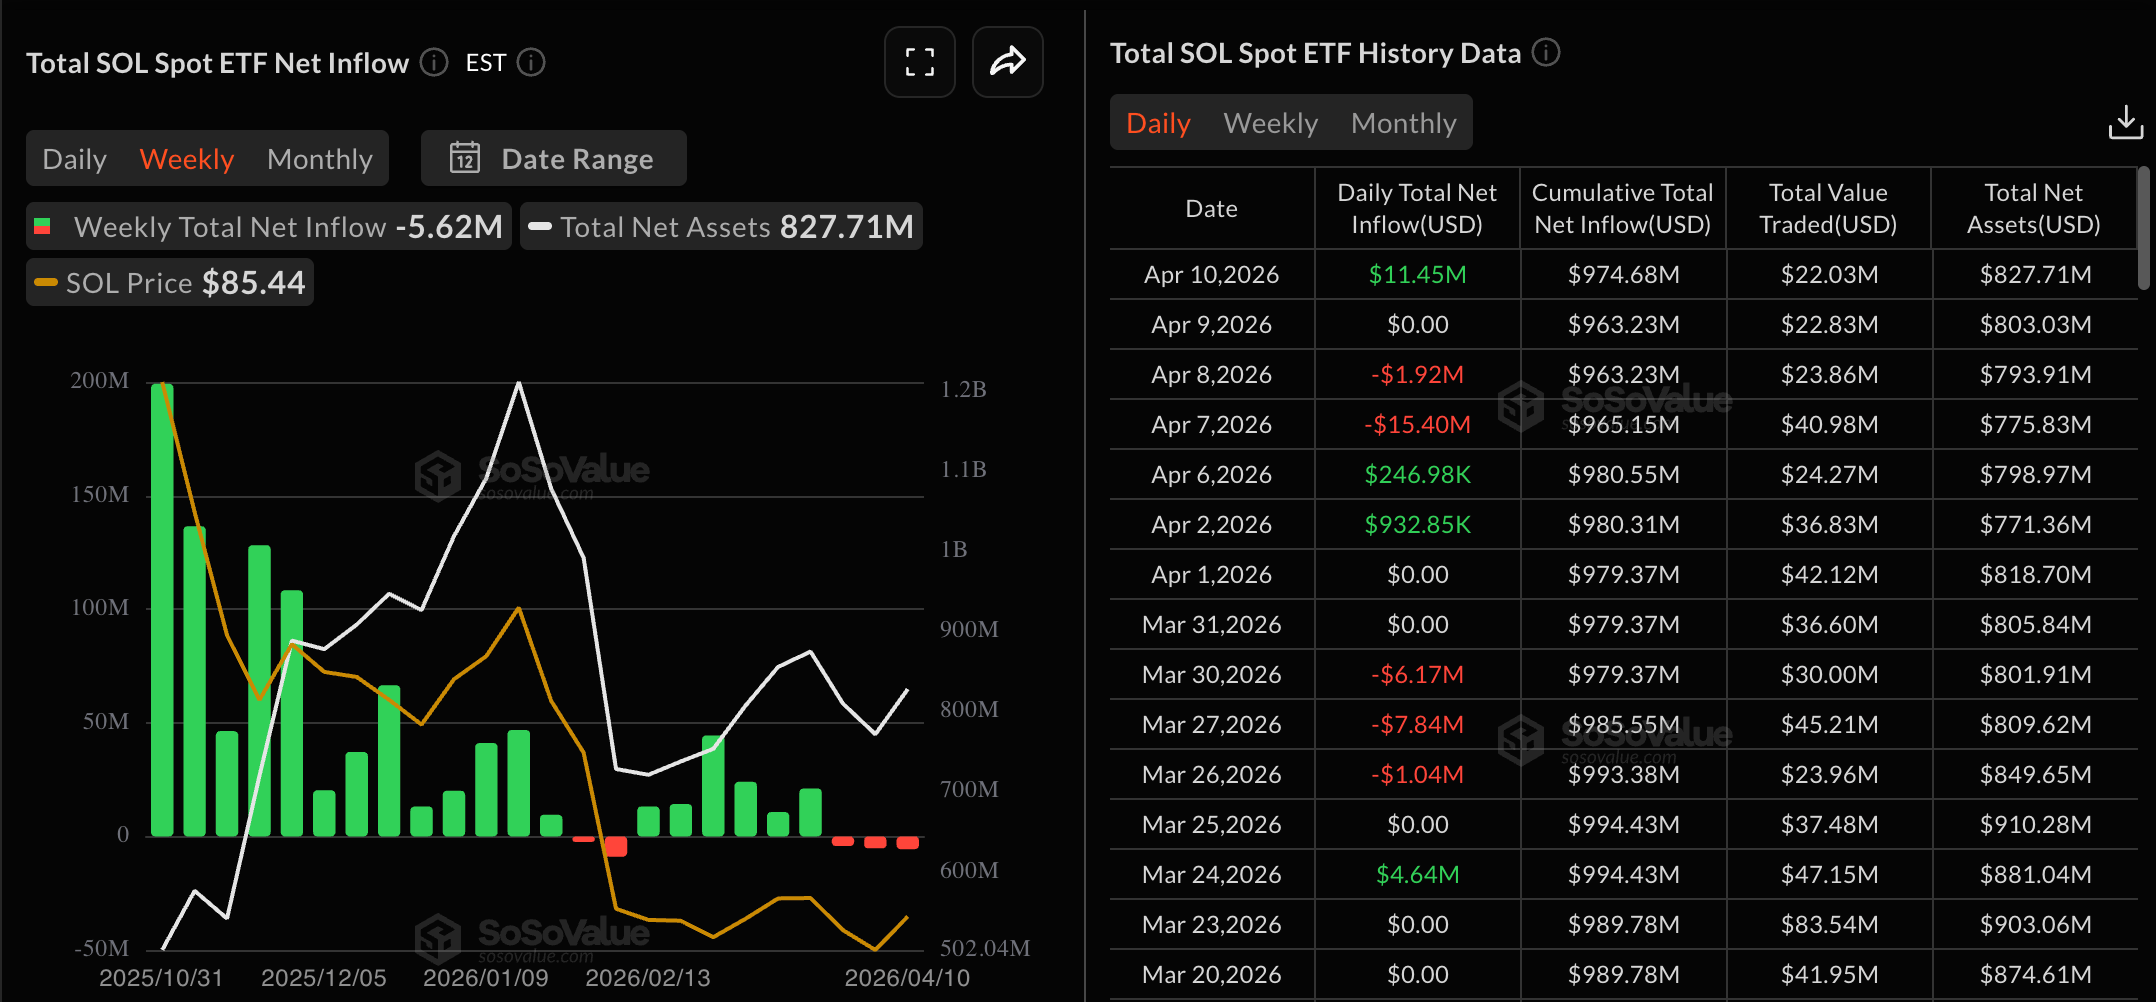
- SOL-focused ETFs recorded over $11 million in inflows on Friday, limiting the weekly outflow to under $6 million.
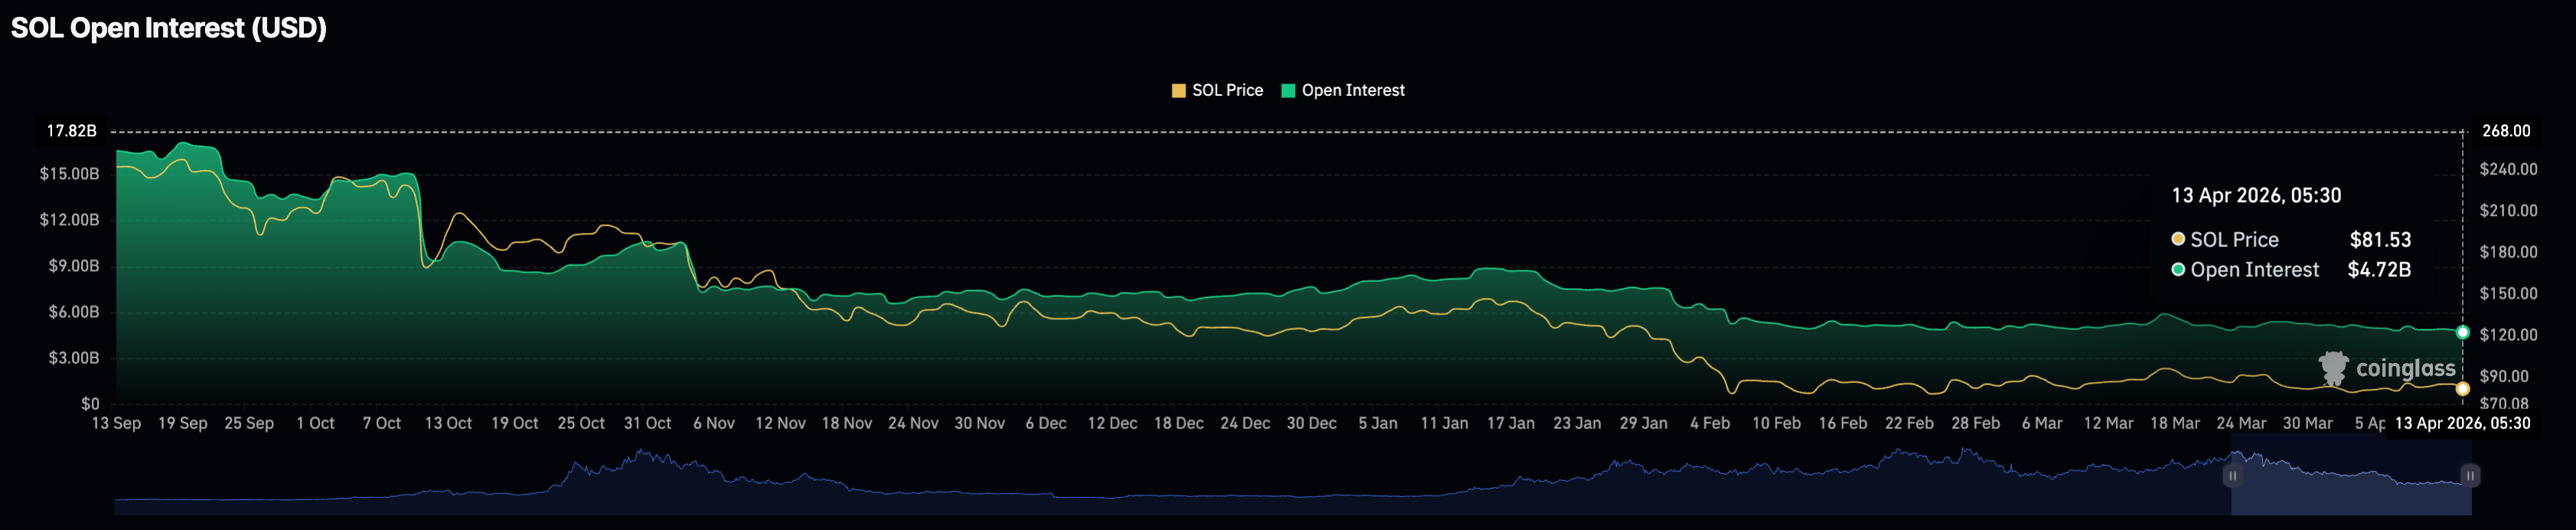
- Solana futures Open Interest is waning as traders' sentiment remains risk-averse.

Solana (SOL) is trading under pressure at around $80 at press time on Monday, after a 4% decline on Sunday, which aligned with the broader cryptocurrency market correction. Solana remains on a downside trajectory after reversing from an overhead trendline, while institutional demand whipsaws and retail interest declines. Technically, Solana should sustain above $77 to avoid a steeper correction.
Solana ETFs limit outflow while retail walks to the sidelines
Solana is facing mixed-to-slightly bearish reactions in the institutional and derivatives markets amid the US-Iran blockade of the Strait of Hormuz. SoSoValue data shows that the Solana Exchange Traded Funds (ETFs) recorded $11.45 million in inflows on Friday, limiting the weekly outflow to $5.62 million. This sudden inflow reinforces institutional strength in Solana but marks the third consecutive weekly outflow.
Meanwhile, CoinGlass data shows a steady decline in the notional value of outstanding Solana derivatives contracts, or Solana Open Interest (OI), to $4.72 billion on Monday, down from $4.88 billion the previous day, suggesting reduced risk appetite among traders.
Technical outlook: Will Solana drop below $80?
Solana maintains a bearish near-term bias as price holds beneath the 50-day Exponential Moving Average (EMA) at $87.43 close to a downward resistance trendline. Meanwhile, the 100- and 200-day EMAs at $99.19 and $118.32, respectively, reinforce a broader topside cap.
Momentum is mixed, with the Relative Strength Index (RSI) hovering at 45 and the Moving Average Convergence Divergence (MACD) line below zero, hinting that downside pressure is softening but not yet reversing the overall capped structure.
The immediate support for Solana aligns with the February 5 low at $77.60, which guards the downside toward the February 6 low at $67.50.
On the topside, initial resistance emerges at the 50-day EMA at $87.43, where sellers could look to fade rebounds. Above that, the 100-day EMA at $99.19 and the 200-day EMA at $118.32 stand out as progressively stronger barriers.
(The technical analysis of this story was written with the help of an AI tool.)
Author

Vishal Dixit
FXStreet
Vishal Dixit holds a B.Sc. in Chemistry from Wilson College but found his true calling in the world of crypto.




