Solana Price Forecast: Bulls hold control as ETF inflows strengthen and RWAs, stablecoin metrics hit records
- Solana edges lower and trades below $119 on Monday after gaining more than 22% over the past two weeks.
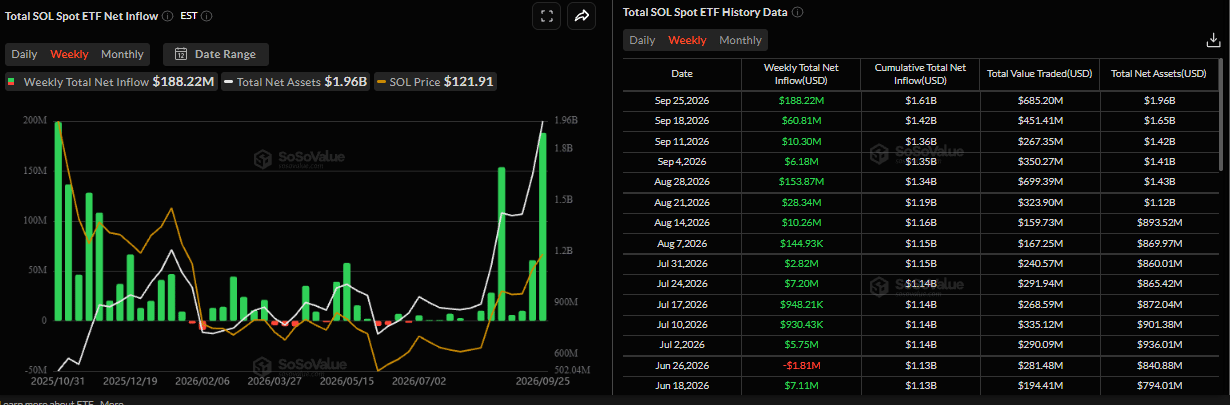
- US-listed spot ETFs recorded an inflow of $188.22 million last week, the second-highest weekly inflow since their launch.
- Stablecoin supply on SOL hit a new record high of $17.3 billion, while its RWA ecosystem also hit a new all-time high of over $4.6 billion.

Solana (SOL) faces a mild pullback, trading below $119 on Monday after gaining over 22% in the last two weeks. Despite this correction, SOL bulls remain in control, with institutional demand recording the second-highest weekly inflow through spot Exchange Traded Funds (ETFs).
In addition, record levels in stablecoin supply and the real-world asset (RWA) ecosystem suggest strengthening fundamentals, further supporting a bullish outlook for SOL.
Second-highest weekly inflow
SoSovalue data show that SOL spot ETFs recorded a weekly inflow of $188.22 million last week, marking the second-highest weekly inflow since their launch. Moreover, last week's inflow also marked the 13th consecutive week of positive flows since early June, highlighting robust institutional demand. If these inflows continue and intensify through the week, SOL could extend its ongoing rally.
RWAs, stablecoin metrics hit records
Solana's official X account posted on Monday that its ecosystem growth reached record levels.
Stablecoin supply on SOL hit a new all-time high (ATH) of $17.3 billion. In addition, its RWA ecosystem hit a new ATH of over $4.6 billion across 3,000+ available assets, with tokenized equity holders on Solana crossing 1 million.
These milestones suggest the ecosystem is strengthening, supporting a further bullish outlook for SOL.
Solana technical outlook: Faces mild pullback
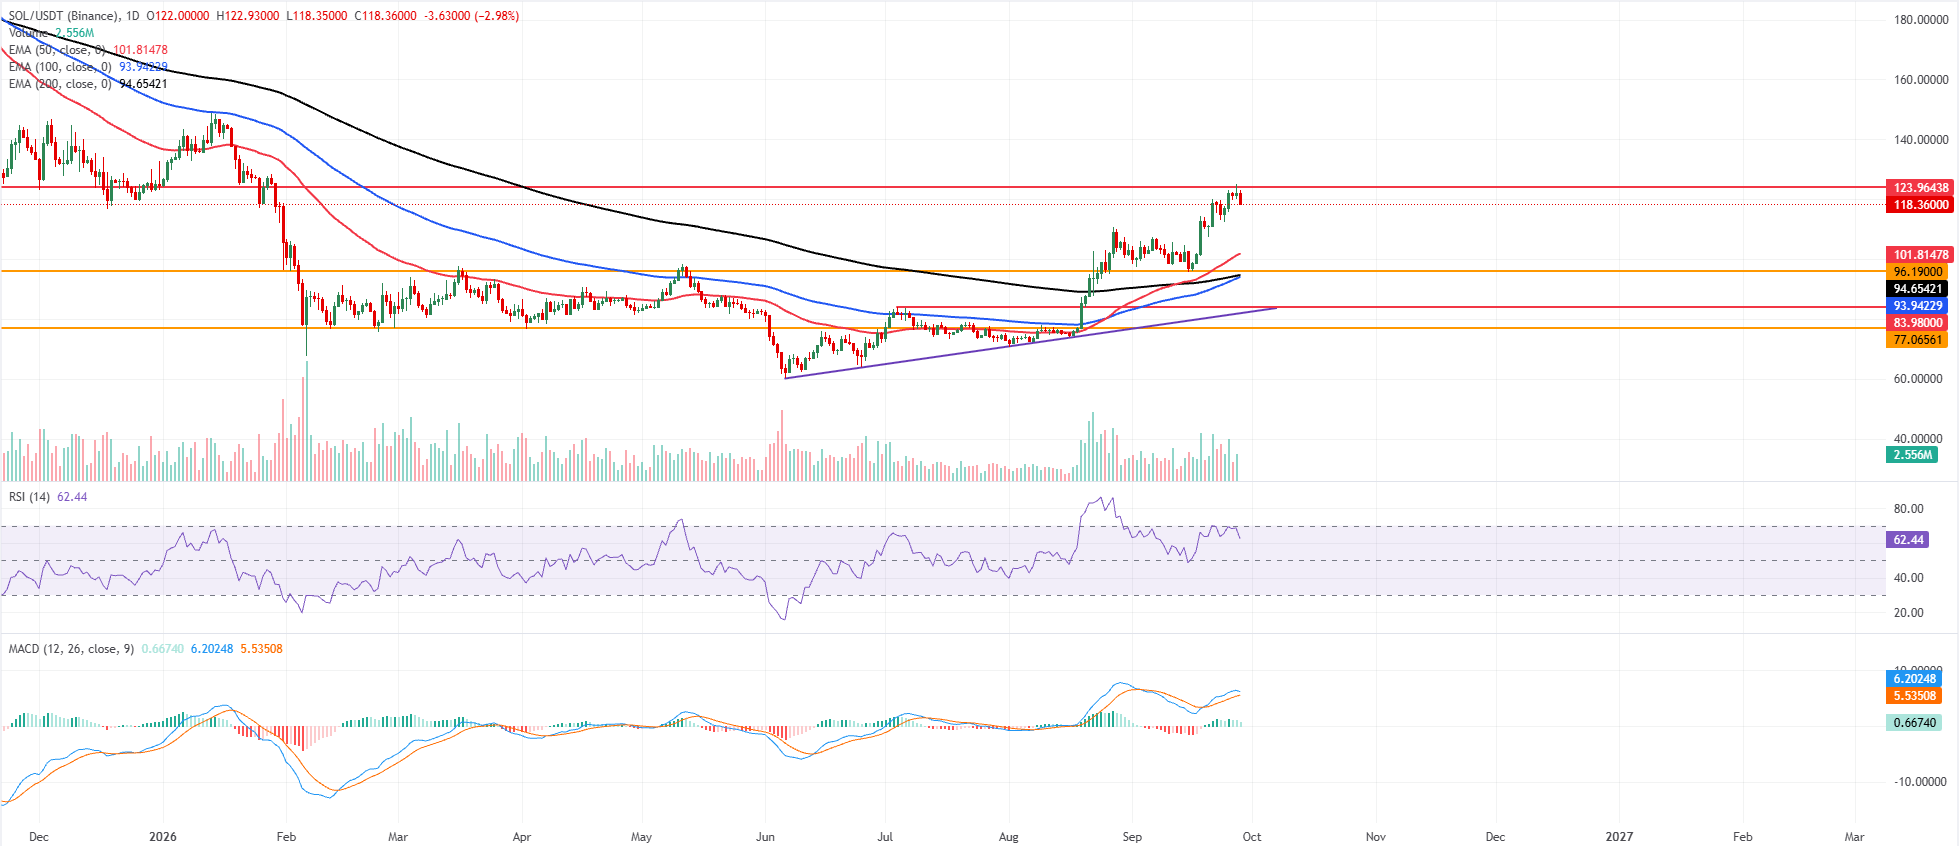
Solana price trades at $118.36 at the time of writing on Monday, holding a bullish near-term bias as it remains comfortably above the 50-day Exponential Moving Average (EMA) at $101.81 and the longer-term 100-day and 200-day EMAs at $93.94 and $94.65, respectively.
The upward-sloping trendline support originating near $81.96 continues to underpin the broader advance. At the same time, the Relative Strength Index (RSI) around 62 on the daily chart suggests constructive but not overbought momentum, reinforced by a positive Moving Average Convergence Divergence (MACD) histogram reading.
On the downside, immediate support emerges at the 50-day EMA near $101.81, followed by the horizontal floor at $96.19 and the clustered longer-term EMAs in the $93–$95 area, ahead of the trendline and horizontal supports at $81.96 and $77.07.
On the topside, initial resistance is seen at the horizontal barrier around $123.96. A daily close above this cap would open the way for a continuation of the prevailing uptrend toward higher levels.
(The technical analysis of this story was written with the help of an AI tool. Know more.)
Author

Manish Chhetri
FXStreet
Manish Chhetri is a crypto specialist with over four years of experience in the cryptocurrency industry.



