Shiba Inu Price Forecast: Bearish metrics signal deeper correction
- Shiba Inu price extends its losses on Tuesday, marking four consecutive days of correction since last week.
- On-chain and derivatives metrics support a bearish bias with falling social dominance, rising short bets and negative funding rates.
- Renewed US-Iran tensions alongside weakening price action indicate a deeper correction for the meme coin.

Shiba Inu (SHIB) extends its losses, trading below $0.0000042 on Tuesday, pointing to four consecutive days of correction since last week. Weakening on-chain data and negative derivatives metrics support a bearish bias. In addition, risk-off sentiment amid rising US-Iran tensions suggest a deeper sell-off is possible for the meme coin.
Fading interest among SHIB investors
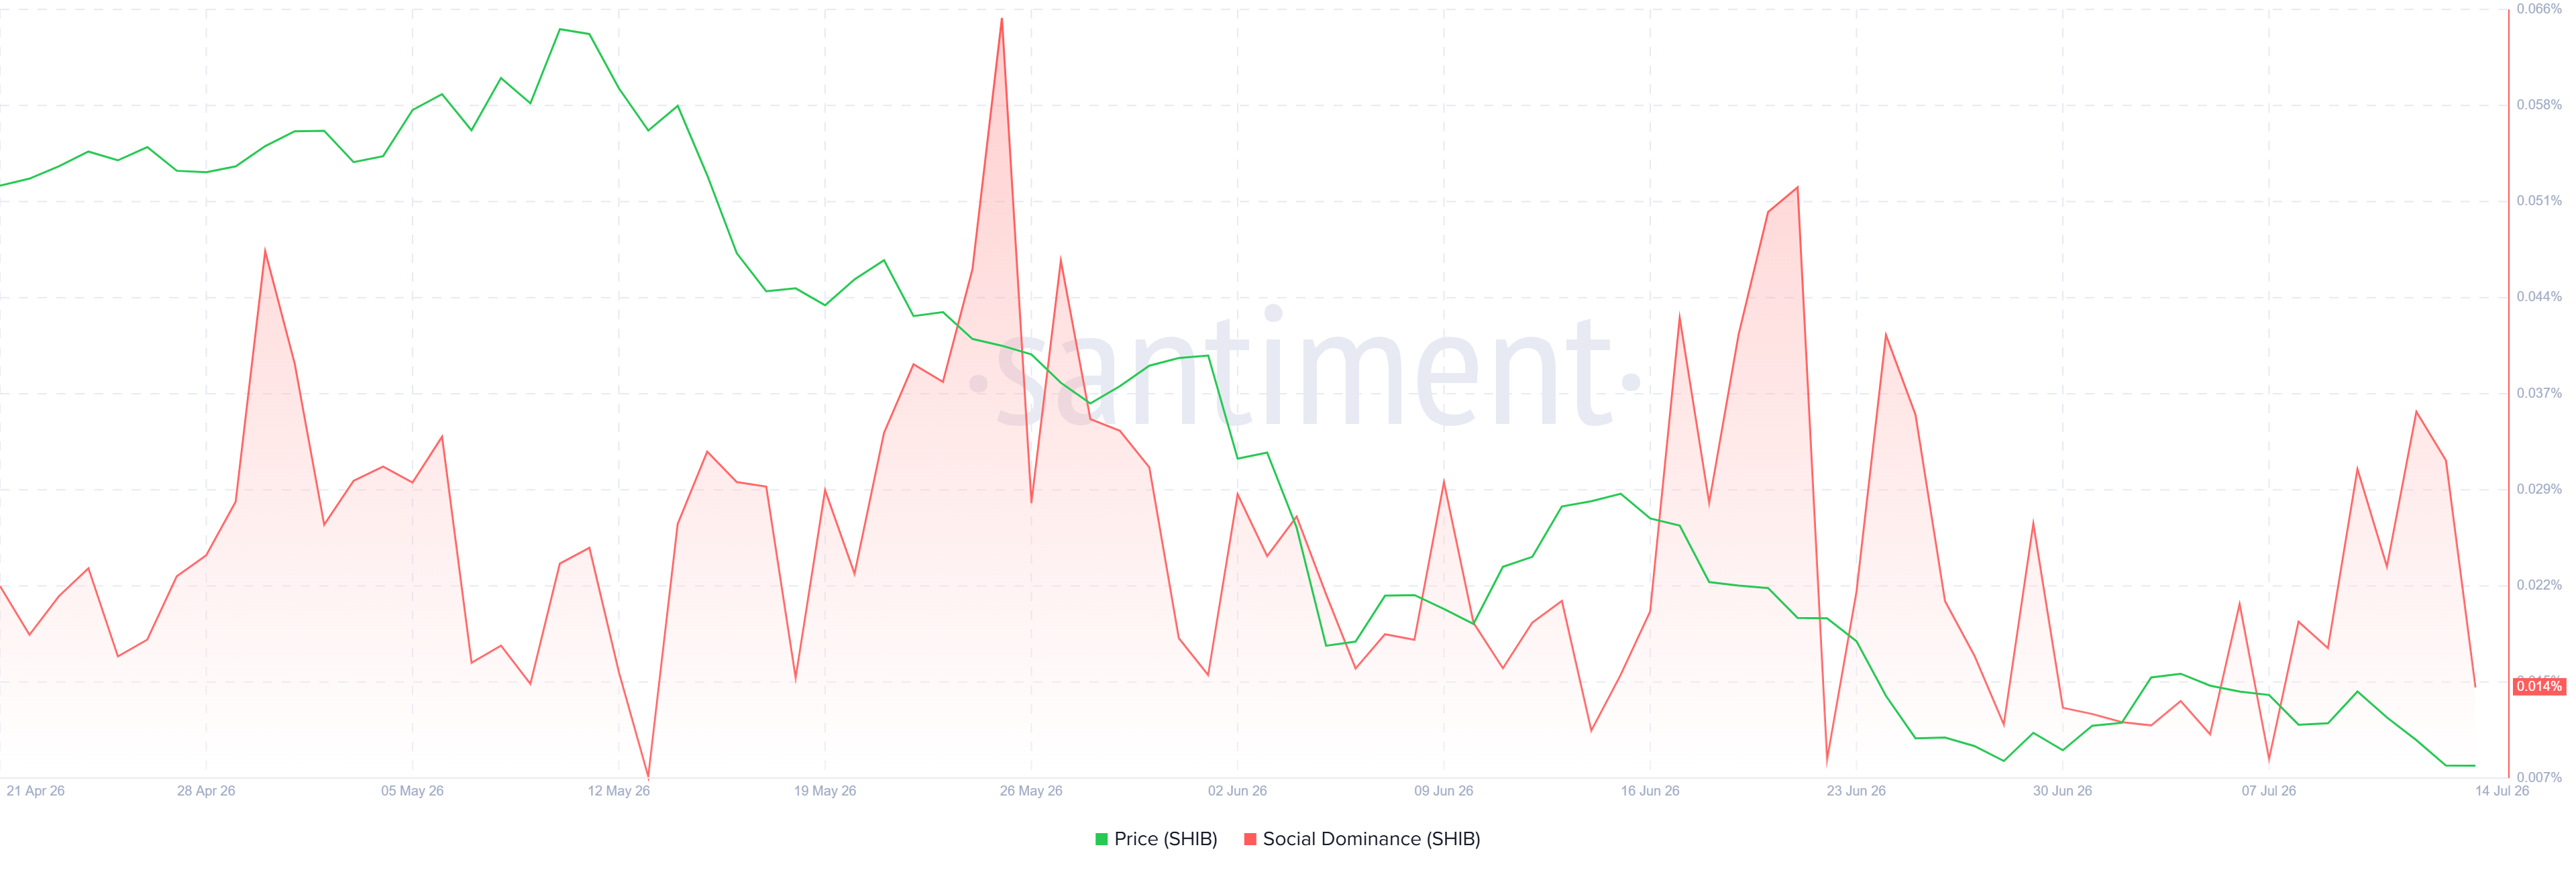
Santiment’s Social Dominance metric for Shiba Inu supports a bearish outlook. The index measures the share of SHIB-related discussions across the cryptocurrency media. It has fallen sharply since a high on July 12, now at 0.014% on Tuesday, nearing the lows seen in early July. This fall indicates fading market interest and sentiment among SHIB investors.
Derivatives metrics show bearish bias
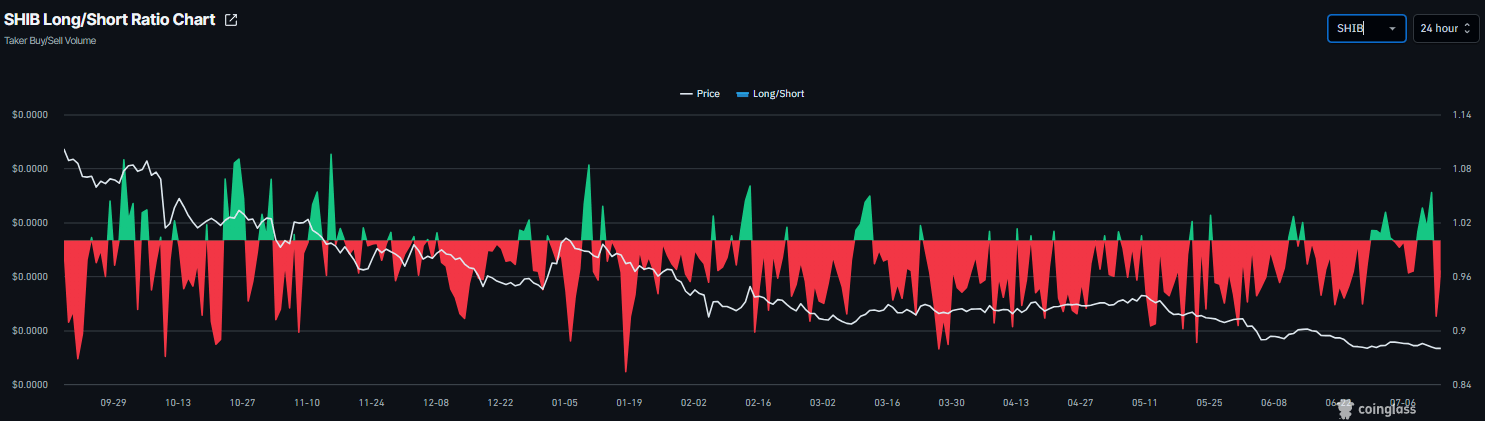
In the derivatives markets, traders are supporting a negative outlook for the meme coin. SHIB’s long-to-short ratio stands at 0.91 on Tuesday, nearing the lowest level over a month. This ratio, being below 1, reflects bearish sentiment in the market, as more traders are betting the asset’s price will fall.
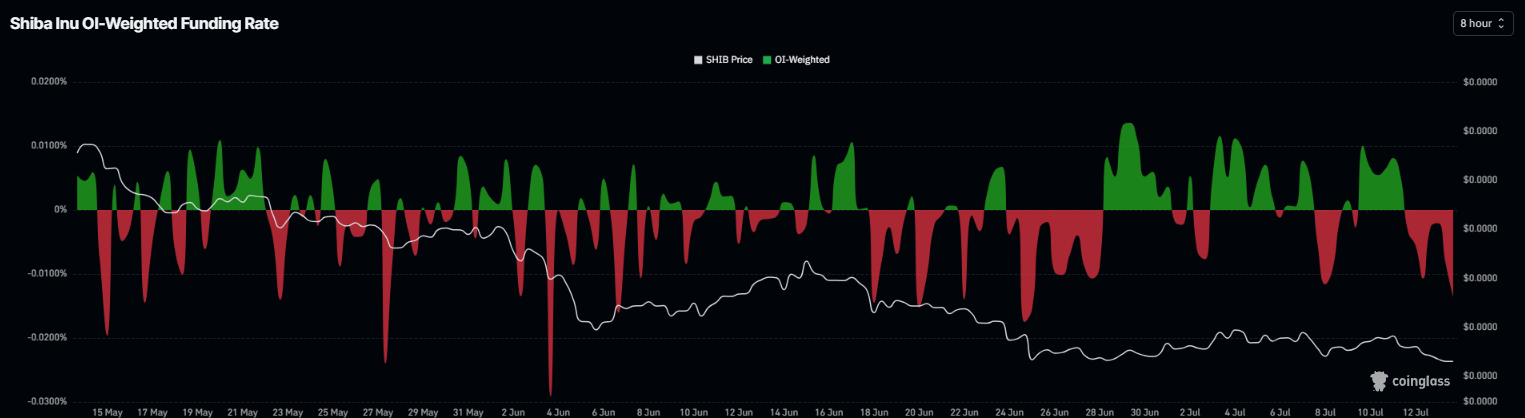
In addition, the funding rate remains negative at -0.0136% on Tuesday, indicating that shorts are paying the longs and suggesting bearish sentiment.
Apart from bearish on-chain and derivatives metrics, rising tensions between the US and Iran this week have dampened traders’ risk appetite. As a highly speculative meme coin, SHIB remains vulnerable to shifts in investor sentiment, increasing the likelihood of a deeper correction.
Shiba Inu Price Forecast: Weakening momentum indicators
Shiba Inu price extends its losses, slipping below $0.0000042 on Tuesday, correcting over 5% in the last three days after facing rejection from the descending trendline (drawn by joining multiple highs since mid-May).
If SHIB continues its correction, it could extend the decline toward the yearly low at $0.0000040.
The Relative Strength Index (RSI) on the daily chart reads 31, pointing downward toward oversold conditions and indicating strengthening bearish momentum. The Moving Average Convergence Divergence (MACD) indicator lines are about to flip a bearish crossover, further supporting the negative outlook.
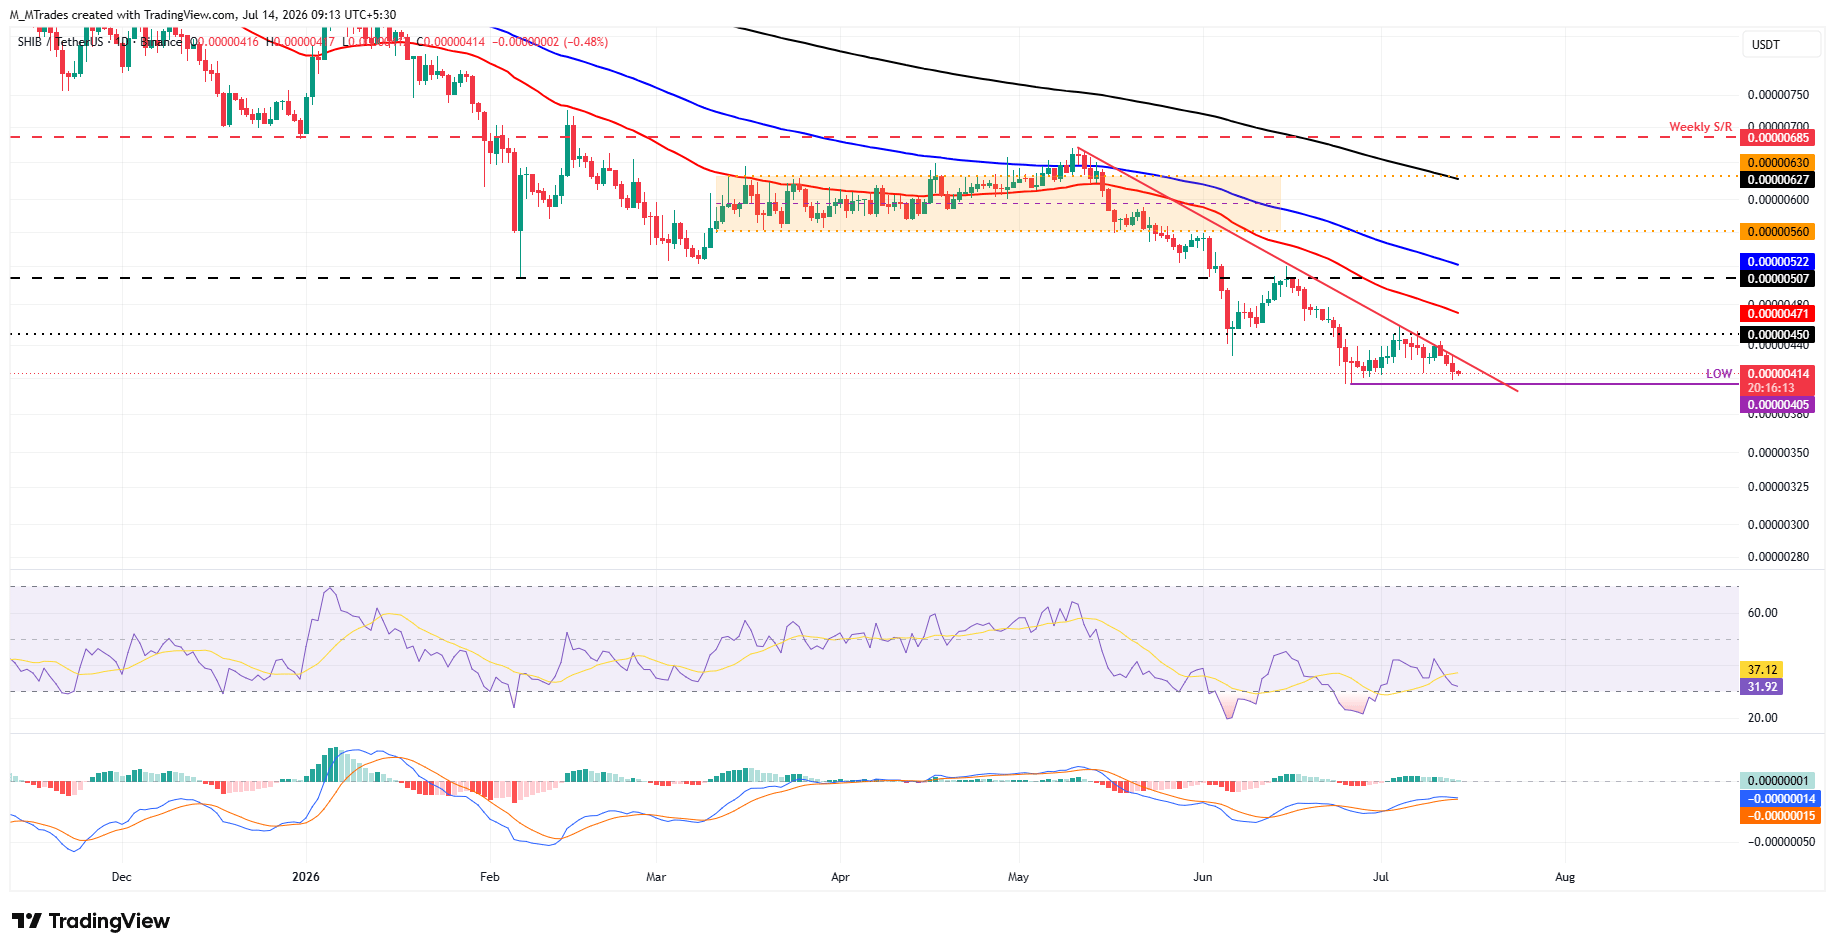
On the other hand, if SHIB recovers, it could extend the advance toward the descending trendline around $0.0000044.
Author

Manish Chhetri
FXStreet
Manish Chhetri is a crypto specialist with over four years of experience in the cryptocurrency industry.



