Ripple's XRP Technical Analysis: XRP/USD here come the bears, a wave could be coming
- Ripple's XRP price on Wednesday trading in the red, down some 2.5% in the second half of the session.
- XRP/USD broken key ascending trend line of support, leaving door open to further pressure.

XRP/USD 15-minute chart
- Buyers remain active within the $0.2900-0.2800 price range, as seen with latest pop higher in near-term demand area.
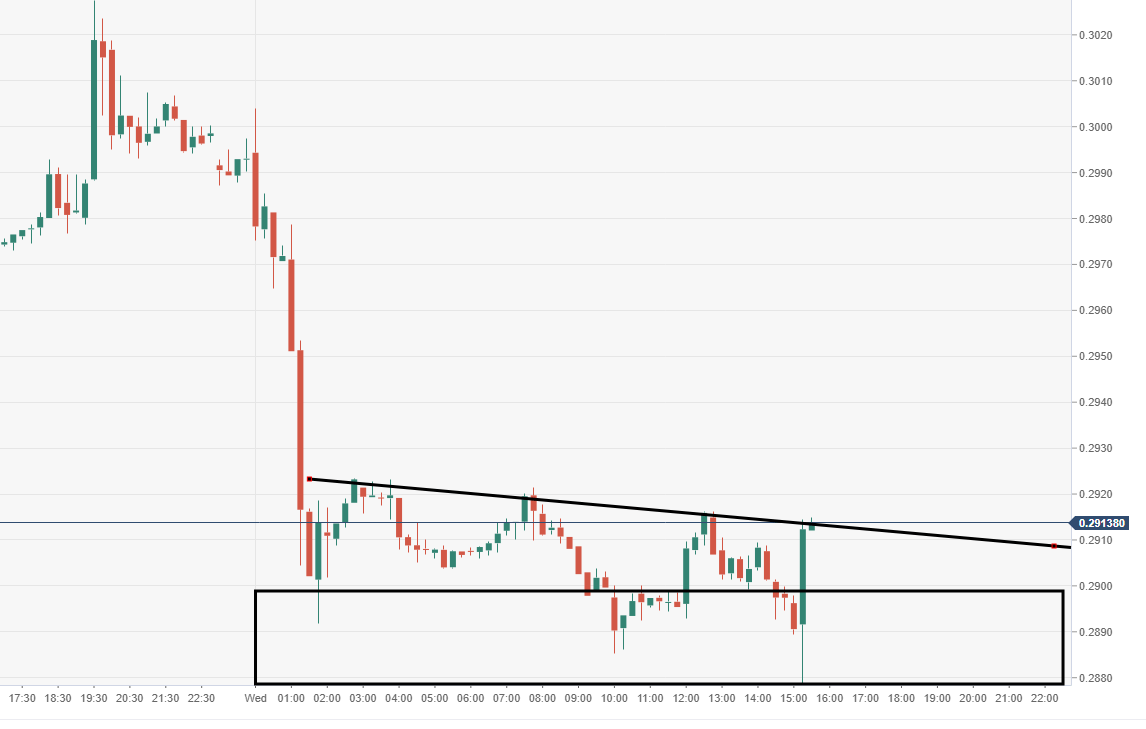
Spot rate: 0.2915
Relative change: -2.60%
High: 0.3003
Low: 0.2876
Trend: Bearish
Support 1: 0.2961, daily pivot point support.
Support 2: 0.2930, daily pivot point support.
Support 3: 0.2897, daily pivot point support.
Resistance 1: 0.3026, daily pivot point resistance.
Resistance 2: 0.3059, daily pivot point resistance.
Resistance 3: 0.3091, daily pivot point resistance.
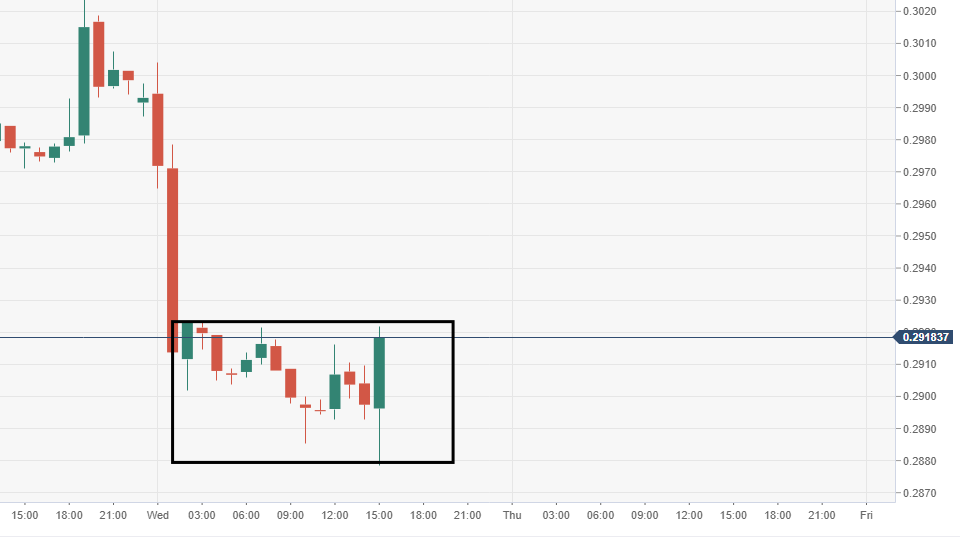
XRP/USD 60-minute chart
- Near-term range-block/consolidation observed after recent drop south.
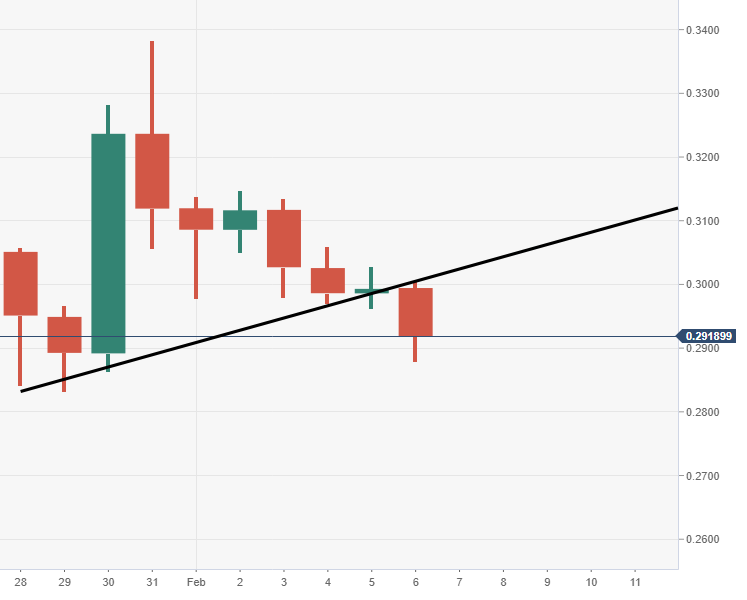
XRP/USD daily chart
- Price slipped out from a daily rising ascending trend line of support.
Author

Ken Chigbo
Independent Analyst
Ken has over 8 years exposure to the financial markets. He started his career as an analyst, covering a variety of asset classes; forex, fixed income, commodities and equities.