|

Ripple's XRP technical analysis: XRP/USD bulls having another go at $0.3000

  • Ripple's XRP price is trading with the green by some 0.65% in the session on Tuesday. 
  • XRP/USD running towards its second consecutive session in the green. 
  • Should the bulls break down 0.3000, it would likely open the door to a fresh wave of selling pressure.  
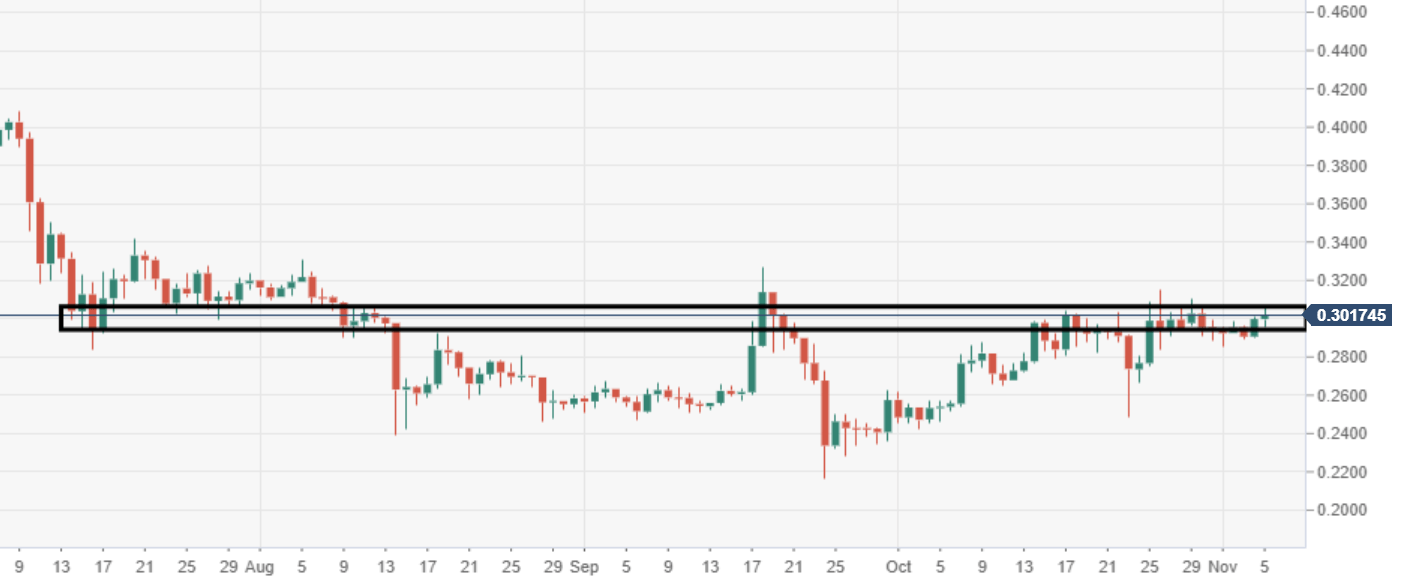
XRP/USD daily chart

The bulls are attempting to again break down the psychological $0.3000 price mark. 

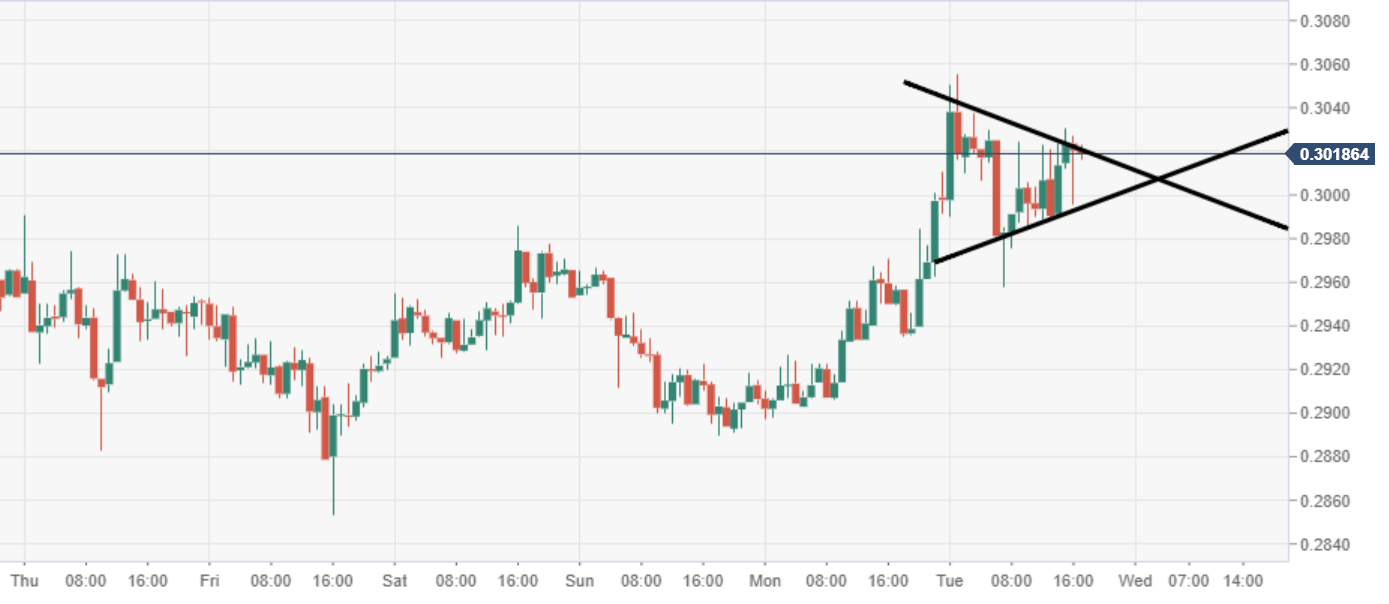
XRP/USD 60-minute chart

Price action is narrowing within a near-term triangular structure, subject to a potential breakout and continued move north.

Spot rate:                 0.3016

Relative change:      +0.65%

High:                         0.3055

Low:                          0.2957

XRP/USD

Overview
Today last price0.3017
Today Daily Change0.0019
Today Daily Change %0.63
Today daily open0.2998
 
Trends
Daily SMA200.2931
Daily SMA500.2769
Daily SMA1000.2786
Daily SMA2000.3253
 
Levels
Previous Daily High0.3011
Previous Daily Low0.2897
Previous Weekly High0.31
Previous Weekly Low0.2854
Previous Monthly High0.315
Previous Monthly Low0.2425
Daily Fibonacci 38.2%0.2967
Daily Fibonacci 61.8%0.2941
Daily Pivot Point S10.2926
Daily Pivot Point S20.2855
Daily Pivot Point S30.2813
Daily Pivot Point R10.304
Daily Pivot Point R20.3082
Daily Pivot Point R30.3154

Author

Ken Chigbo

Ken Chigbo

Independent Analyst

Ken has over 8 years exposure to the financial markets. He started his career as an analyst, covering a variety of asset classes; forex, fixed income, commodities and equities.

More from Ken Chigbo
Share:

Editor's Picks

Ripple technical weakness persists as selling intensifies toward $1.00

Ripple grinds lower, trading around $1.10 at the time of writing on Wednesday. The sticky bearish outlook mirrors the broader crypto market, with major coins such as Bitcoin and Ethereum facing weak demand as investors de-risk.

Crypto Today: Bitcoin, Ethereum, XRP face downside pressure amid investor de-risking

Major crypto assets trade under intense headwinds on Wednesday, as market participants navigate complex geopolitical and macroeconomic environments. Bitcoin has slipped toward $61,000 after its recent rebound was sold near $64,000, leaving buyers exhausted.

Bitcoin Price Forecast: Sticky inflation fears threaten deeper sell-off in BTC

Bitcoin extends its decline on Wednesday, trading below $61,500 at the time of writing as renewed US-Iran tensions keep the risk sentiment capped. In addition, persistent capital outflows from US-listed spot Exchange Traded Funds continue to fuel selling pressure on BTC.

Pi Network extends decline as CEX outflows fail to offset bearish pressure

Pi Network edges lower on Wednesday, extending its third consecutive day of losses. The technical outlook for PI is largely bearish, with a risk of a steeper correction below $0.1184.

Bitcoin: After the bloodbath, everyone looks at $60,000
Bitcoin (BTC) hovers above $62,000 at the time of writing on Friday, weighed down by growing risk-off sentiment due to persistent geopolitical tensions in the Middle East and sticky macroeconomic uncertainty. The institutional sell-off continued to wreak havoc on capital flows, with spot Bitcoin Exchange-Traded Funds (ETFs) recording billions in outflows.