XRP grapples with risk-off sentiment and bearish signals
- XRP struggles to stay above $1.15 on Tuesday after a rejection near $1.20 the previous day.
- Risk-off sentiment persists, as reflected in the weak derivatives market and muted XRP ETF activity.
- XRP’s upside remains largely limited by declining major moving averages and a bearish Parabolic SAR indicator.

Ripple (XRP) trades above $1.15 on Tuesday, following a rejection near $1.20. The remittance token mirrors the broader risk-off mood, with Bitcoin (BTC) stalling around $63,000 and Ethereum (ETH) trading below $1,700.
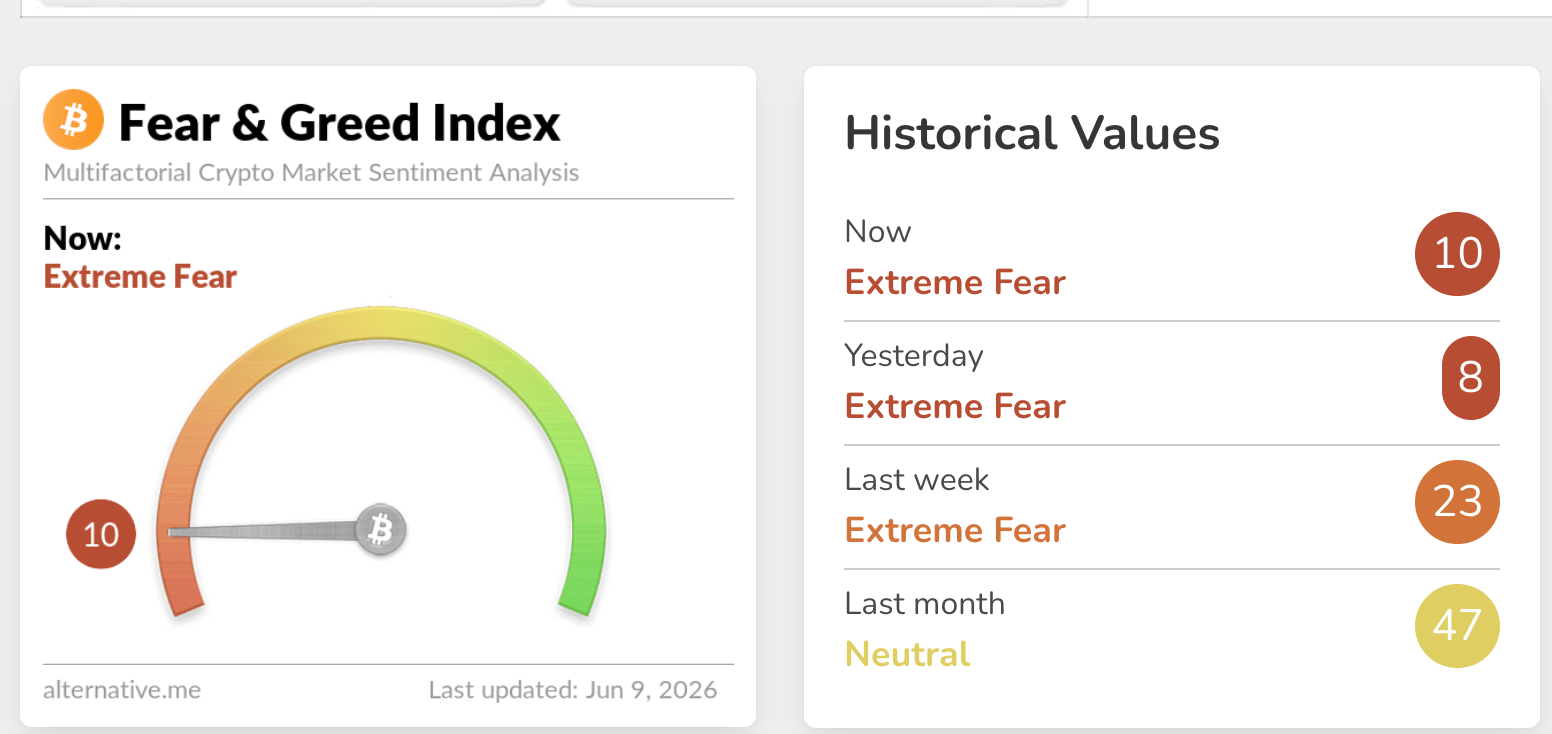
The Crypto Fear & Greed Index remains in Extreme Fear territory at 10 on Tuesday, marginally increasing from 8 the previous day. Weak sentiment suggests a lack of confidence in the crypto market's ability to sustain a recovery. Persistent weakness could lower the odds of an XRP rebound toward the $2.00 level.
Risk-aversion grows amid muted demand
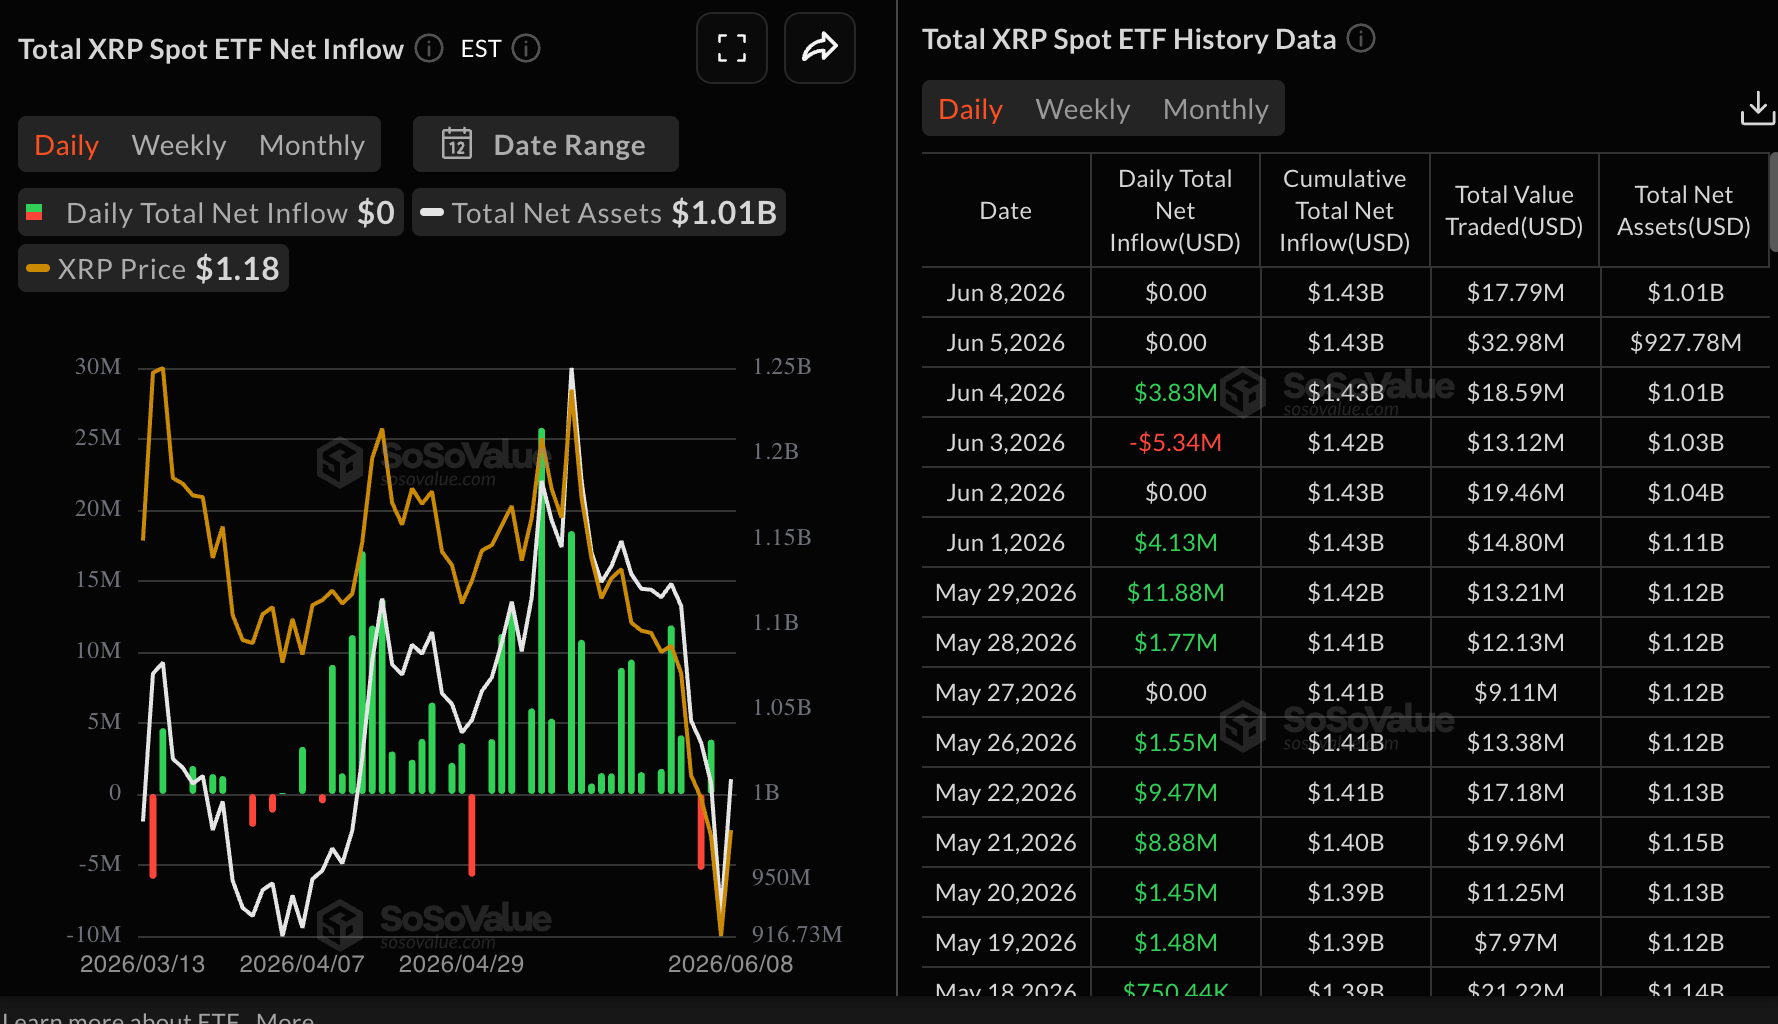
Institutional engagement with XRP digital investment products remains limited, as demonstrated by subdued activity in spot Exchange-Traded Funds (ETFs). SoSoValue data shows that XRP ETFs remained quiet on Monday, leaving cumulative inflows at $1.43 billion while net assets under management increased to $1.01 billion, up from $928 million the previous day.
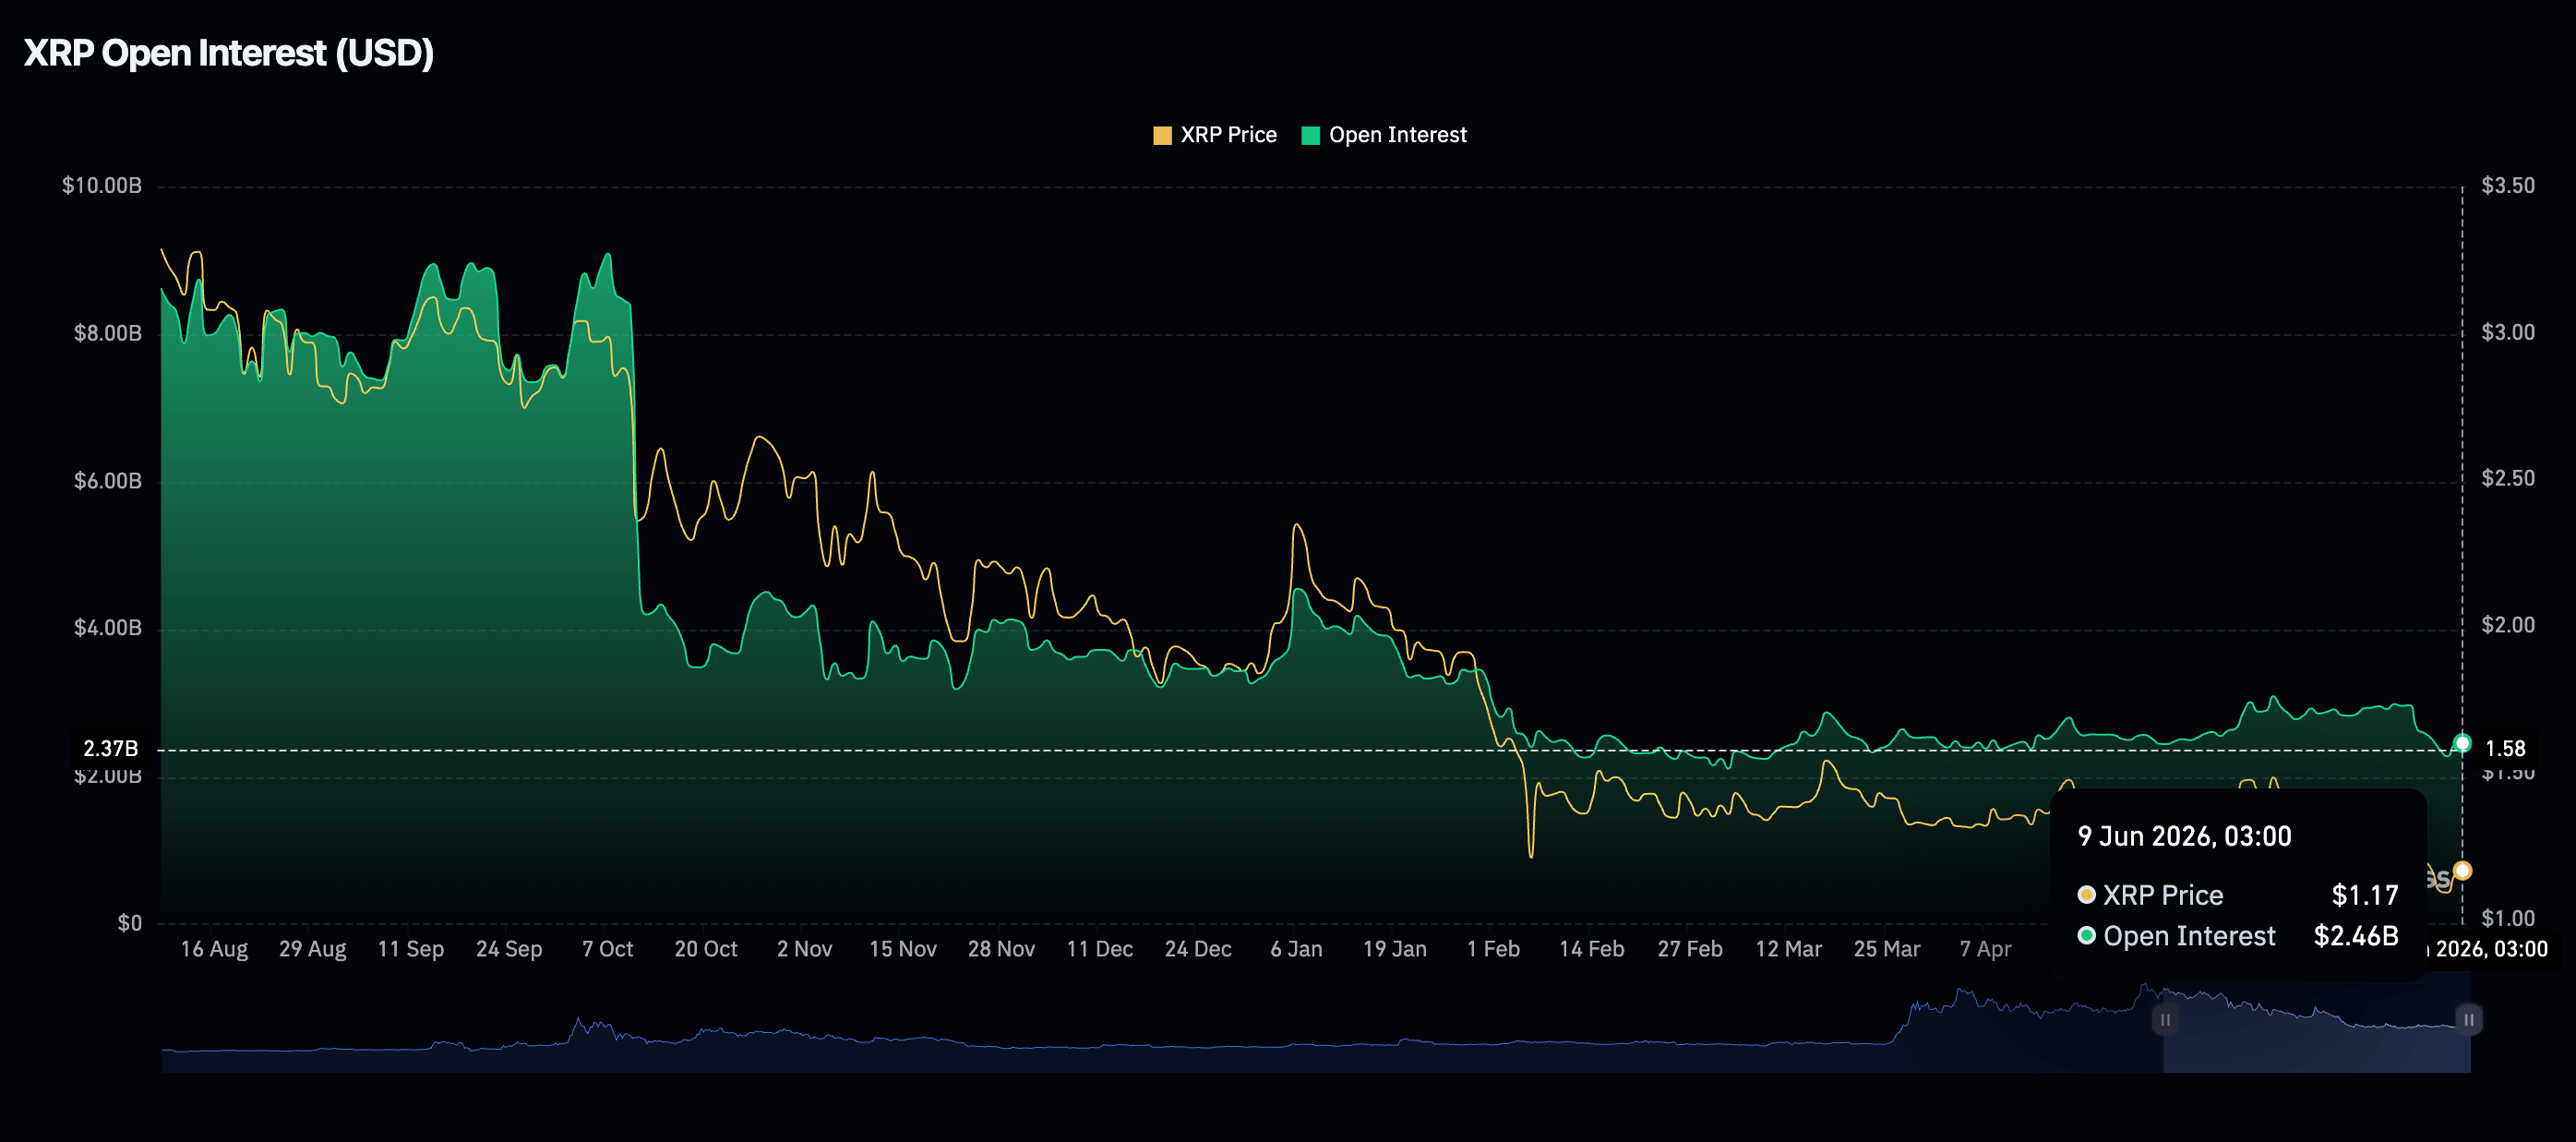
Demand for XRP derivatives holds steady with the futures Open Interest (OI) at $2.44 billion on Tuesday, increasing from the $2.28 billion recorded on Sunday. A sustained uptick in retail participation is essential to fuel a broader recovery in the XRP. However, subdued demand suggests XRP lacks the tailwind needed to sustain the uptrend.
Price analysis: XRP maintains broader bearish structure
XRP trades above $1.15, maintaining a bearish near-term bias as price holds below the 50-day Exponential Moving Average (EMA) at $1.32, the 100-day EMA at $1.41and the 200-day EMA at $1.62, keeping the broader structure under clear downside pressure.
The Parabolic SAR indicator at $1.25 also sits above spot, reinforcing the idea that rallies remain capped for now, while the Relative Strength Index (RSI) near 33 on the daily chart hints at sustained but not yet extreme oversold conditions.
At the same time, the Moving Average Convergence Divergence (MACD) histogram remains in negative territory on the same chart, but contracting, suggesting that downside momentum is starting to moderate.
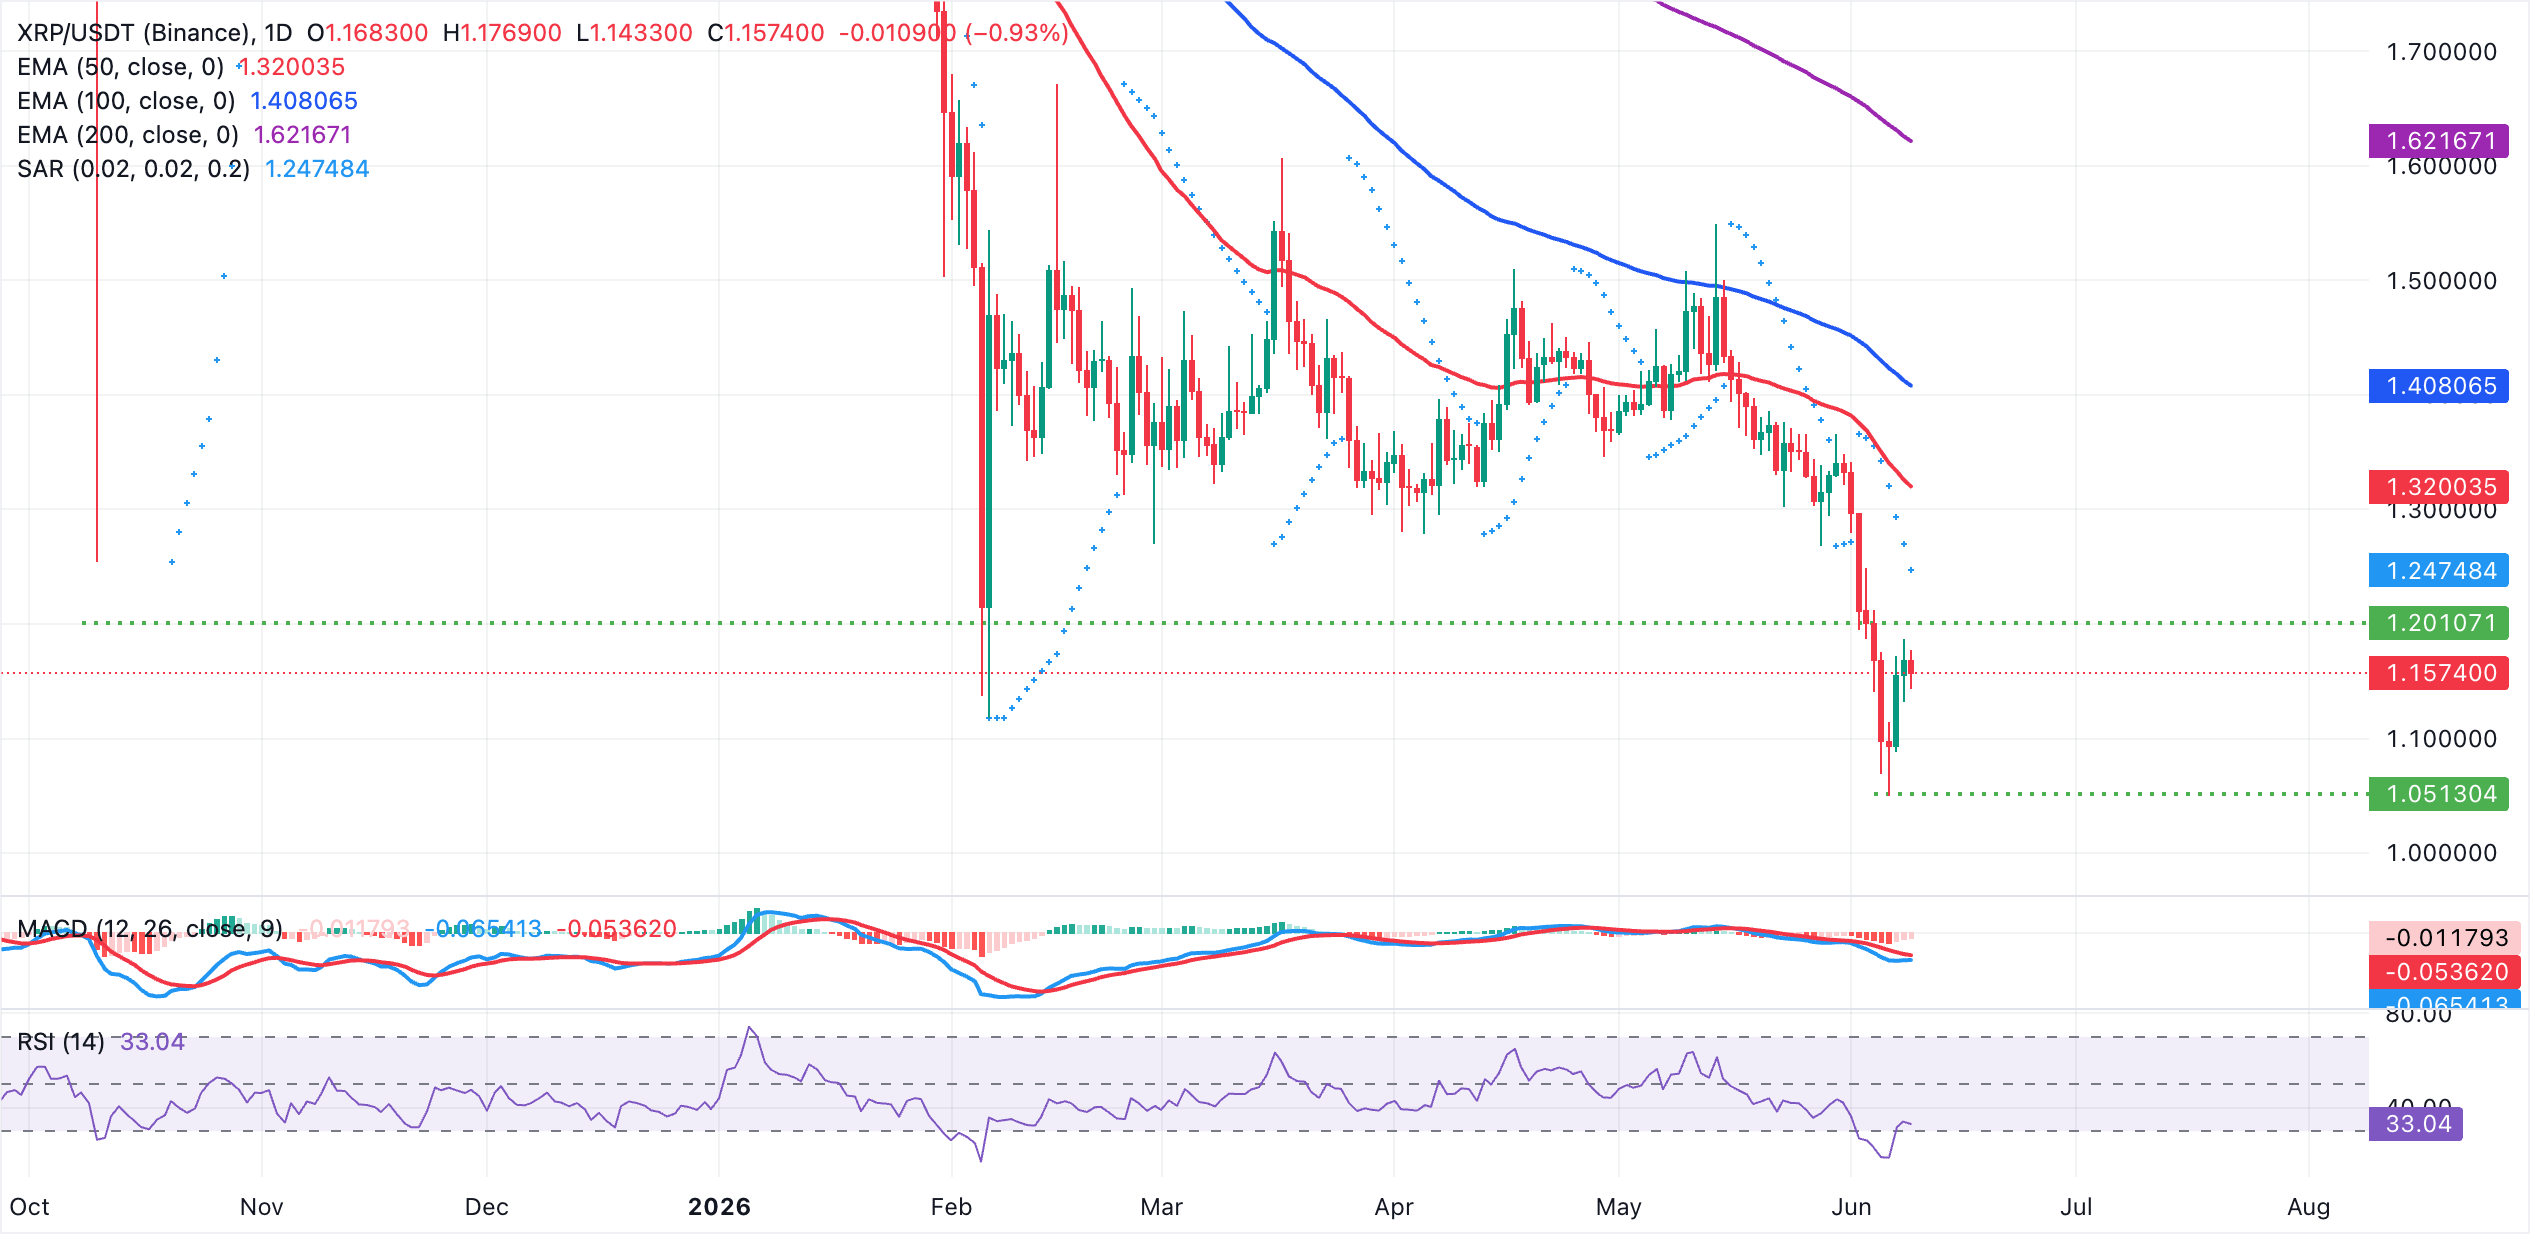
On the topside, initial resistance emerges at the Parabolic SAR barrier around $1.25, with the 50-day EMA at $1.32 forming the next key cap if buyers attempt a deeper rebound. Above these resistance levels, the 100-day EMA at $1.41 and the 200-day EMA near $1.62 outline a broader supply band that would need to be reclaimed to ease the prevailing bearish tone.
In the absence of any nearby structural support levels, a deeper correction would retest $1.05 and $1.00 levels, respectively and attract potential buy-the-dip demand. Still, failure to overcome these caps would keep XRP vulnerable to renewed selling on any recovery attempts.
(The technical analysis of this story was written with the help of an AI tool.)
Open Interest, funding rate FAQs
Higher Open Interest is associated with higher liquidity and new capital inflow to the market. This is considered the equivalent of increase in efficiency and the ongoing trend continues. When Open Interest decreases, it is considered a sign of liquidation in the market, investors are leaving and the overall demand for an asset is on a decline, fueling a bearish sentiment among investors.
Funding fees bridge the difference between spot prices and prices of futures contracts of an asset by increasing liquidation risks faced by traders. A consistently high and positive funding rate implies there is a bullish sentiment among market participants and there is an expectation of a price hike. A consistently negative funding rate for an asset implies a bearish sentiment, indicating that traders expect the cryptocurrency’s price to fall and a bearish trend reversal is likely to occur.
Author

John Isige
FXStreet
John Isige is a seasoned cryptocurrency journalist and markets analyst committed to delivering high-quality, actionable insights tailored to traders, investors, and crypto enthusiasts. He enjoys deep dives into emerging Web3 tren



