XRP extends three-day rally as easing Middle East tensions bolster bullish momentum
- XRP climbs above $1.23, extending three consecutive days of gains as geopolitical tensions in the Middle East ease.
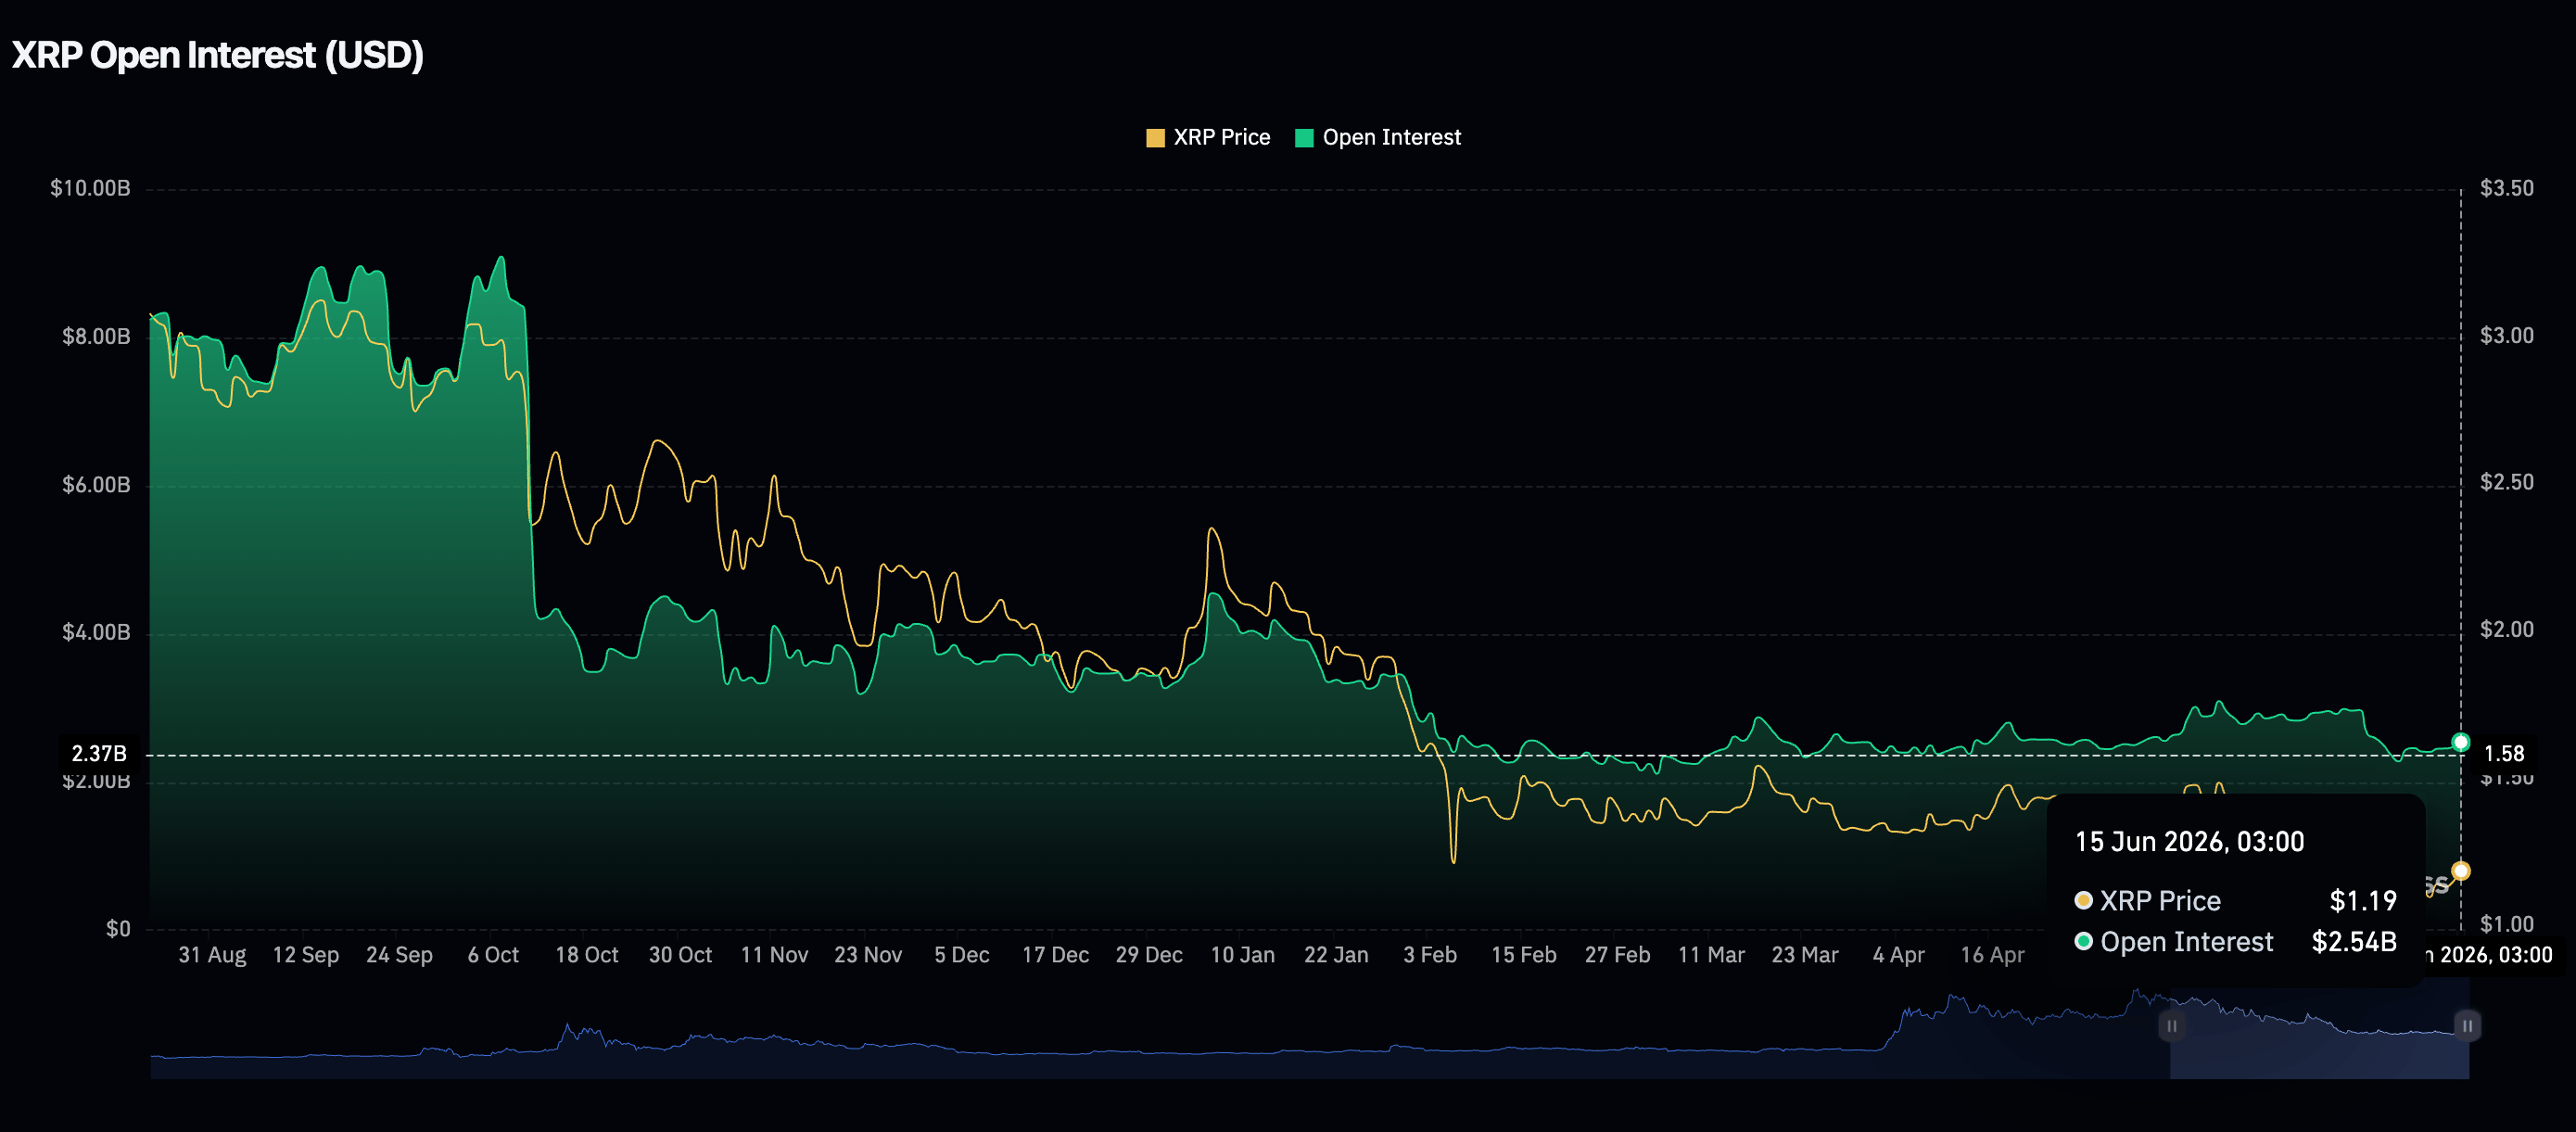
- XRP sees a mild return in appetite for derivatives, with futures Open Interest rising to $2.54 billion.
- XRP’s technical outlook strengthens as momentum indicators trend higher, with the RSI turning bullish and the MACD flashing a fresh buy signal.

Ripple (RSI) trends higher at the time of writing on Monday, supported by a broader improvement in sentiment after the United States (US) and Iran confirmed a preliminary peace agreement, which is expected to take effect on Friday.
XRP gains momentum underpinned by easing geopolitical tensions
Reports that the US and Iran have reached a tentative agreement to end the war continue to lift sentiment across the crypto market. According to CNN, US President Donald Trump stated that as part of the agreement, the naval blockade on Iranian ports will be lifted and the Strait of Hormuz reopened, removing the chokehold on global Oil and Gas supplies. The full text of the peace deal has not yet been released.
The CNN report said that the ceasefire agreement reached in early April will be extended for 60 days, in both time and scope, to allow the US and Iran to continue nuclear talks.
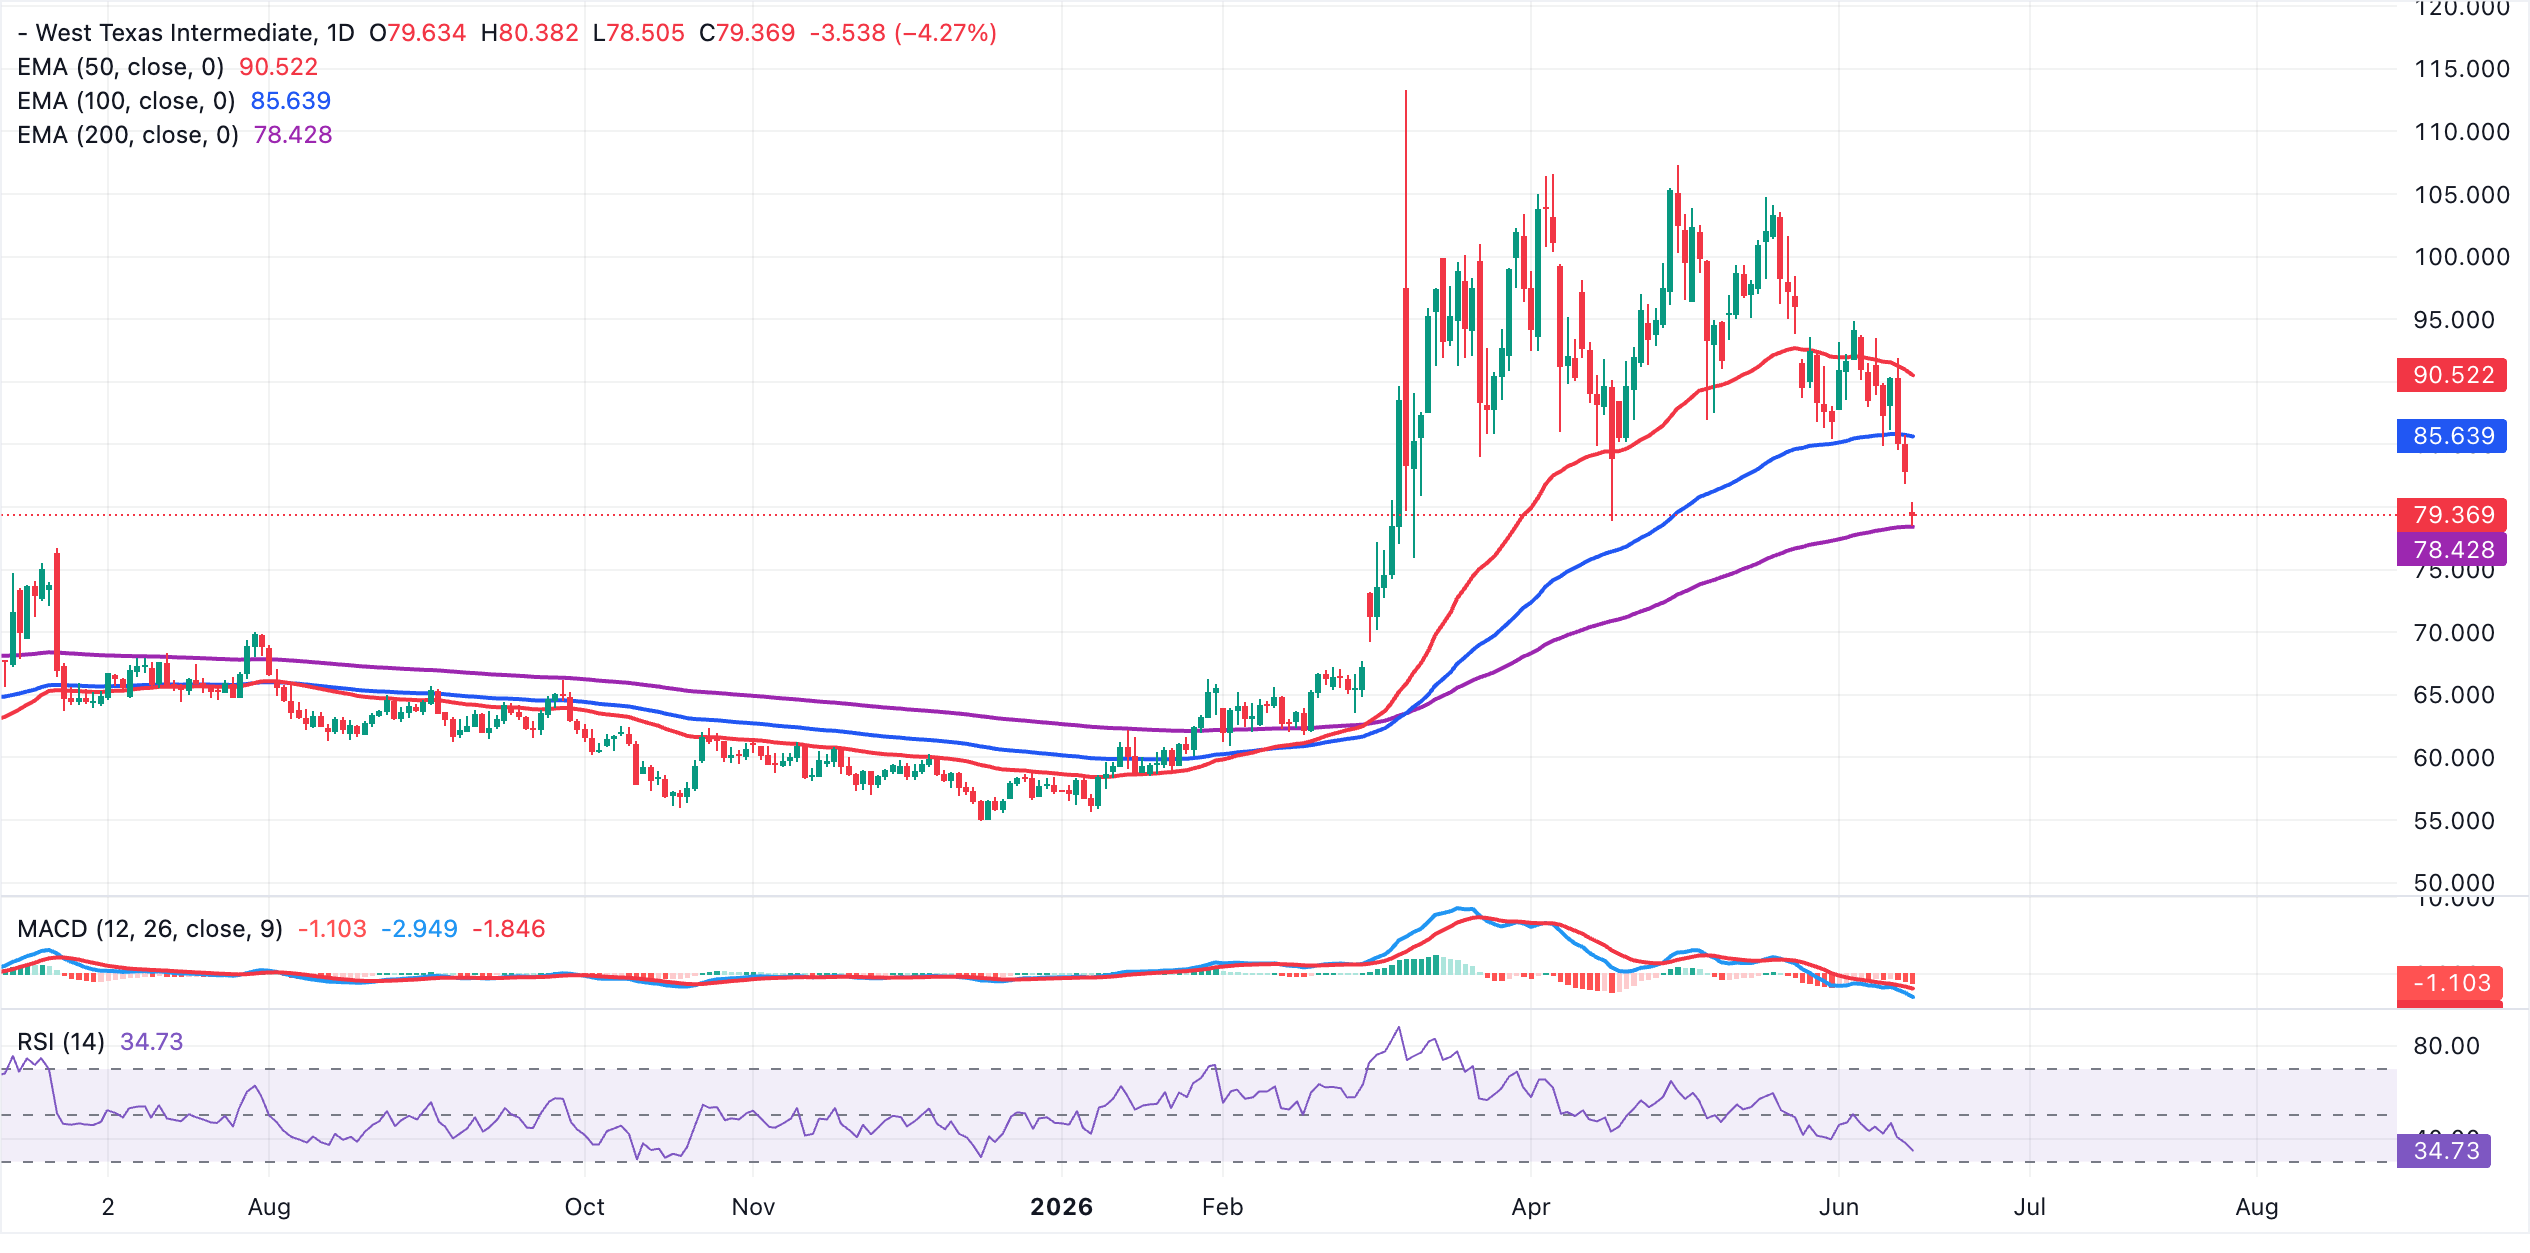
The West Texas Intermediate (WTI) shows continued easing in Oil prices to $79.36 from Friday’s high of $85.76. The moderation in Oil prices offers some relief as US inflation remains elevated, having climbed for a third straight month to 4.2% in May, according to the latest Consumer Price Index (CPI) data.
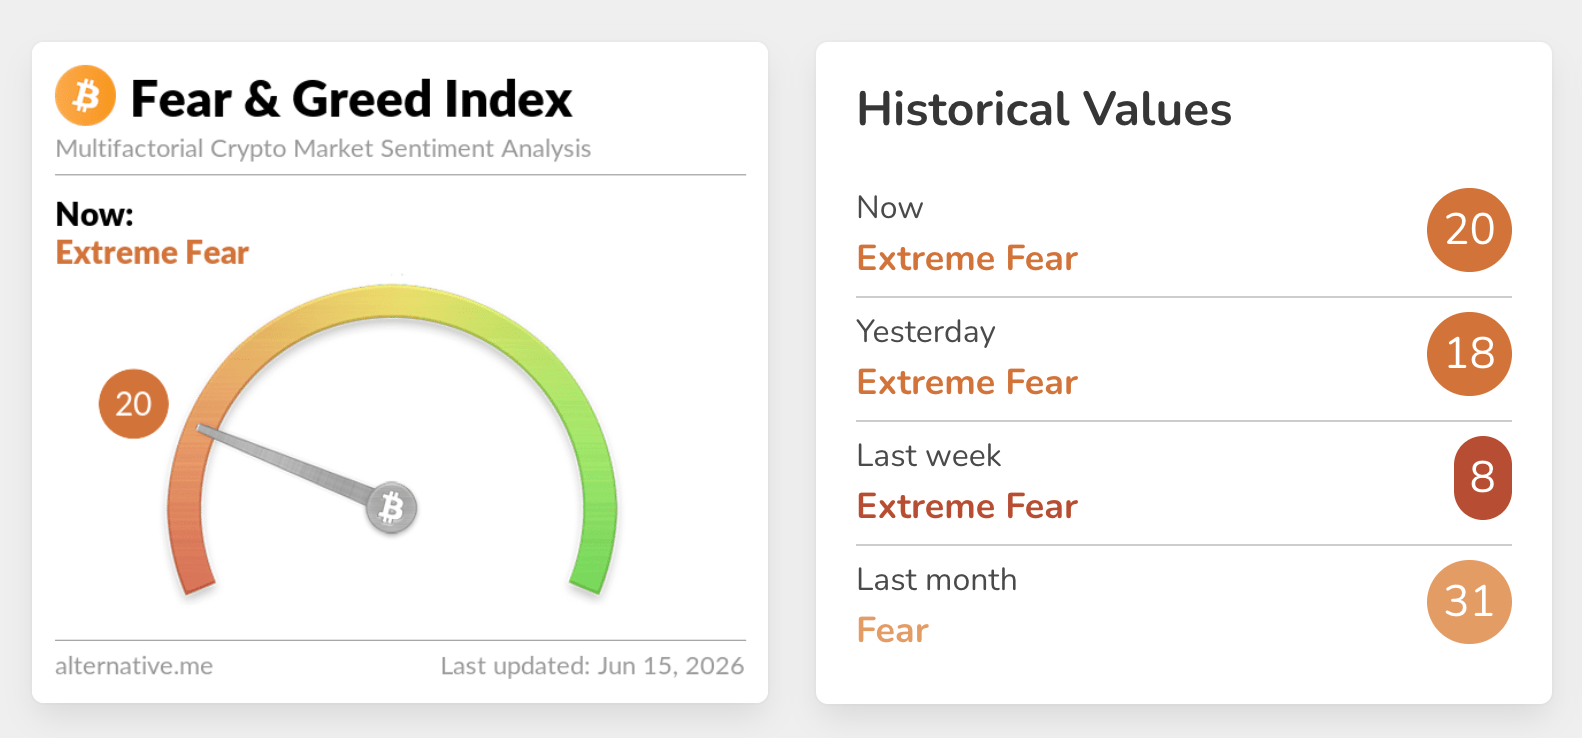
Appetite for risk assets ticked up amid a notable increase in sentiment, as reflected in the crypto Fear & Greed Index, which rose to 20 on Monday from 18 the previous day and last week’s average of 8.
The XRP derivatives market mirrors the broader risk-on sentiment, as the perpetual futures Open Interest (OI) rises to $2.54 billion on Monday, up from $2.48 billion the day before and $2.28 billion on June 7. Although marginal, the increase in the OI suggests that investors are gaining confidence in XRP’s ability to uphold recovery and are willing to increase risk exposure.
Price analysis: XRP reclaims $1.20 as momentum stabilizes
XRP trades near $1.24, following a steady increase from the monthly low of $1.05. While the token remains below the 50-day Exponential Moving Average (EMA) at $1.29, the 100-day EMA near $1.38 and the longer-term 200-day EMA around $1.60, the Moving Average Convergence Divergence (MACD) histogram has turned positive on the daily chart, hinting that near-term momentum is stabilizing. Furthermore, the Relative Strength Index (RSI) has accelerated above 50 on the same chart, indicating that momentum is turning bullish.
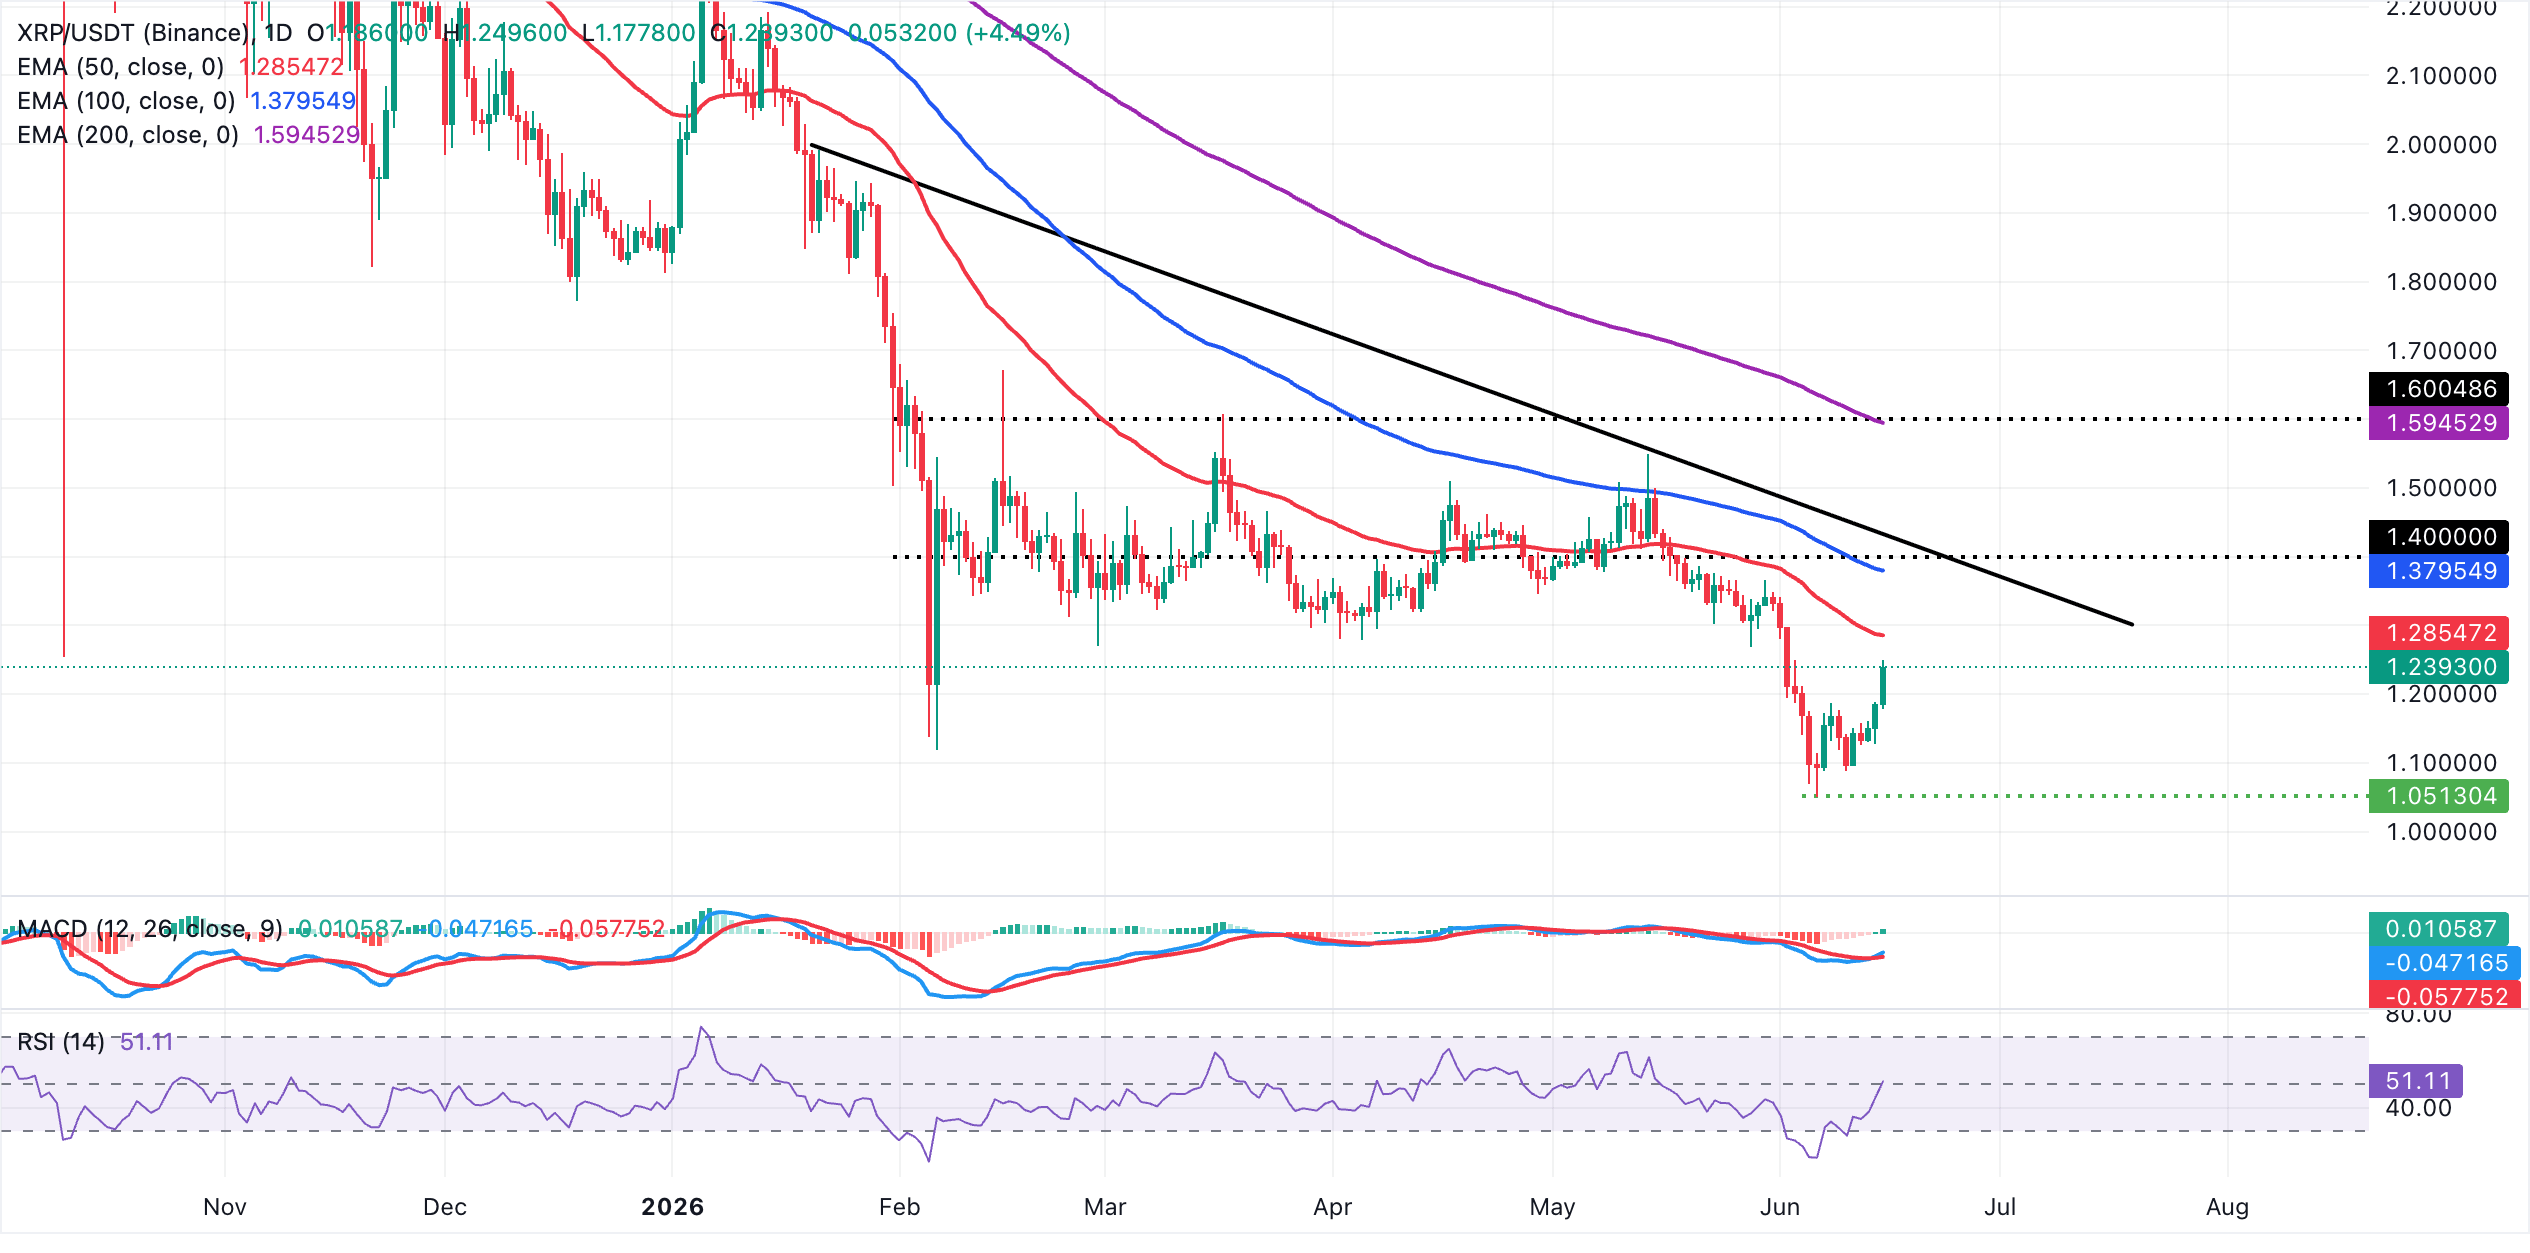
On the topside, initial resistance is seen at the 50-day EMA around $1.29, with further hurdles at the 100-day EMA near $1.38 and the downward resistance trendline break level around $1.43, ahead of the more formidable 200-day EMA close to $1.59.
Looking down, the lack of a clearly defined moving average or structural supports in the daily range suggests that any pullback from current levels could expose XRP to a retest of prior swing lows at $1.05, with buyers needing to defend successive short-term floors to prevent a deeper slide.
(The technical analysis of this story was written with the help of an AI tool.)
Bitcoin, altcoins, stablecoins FAQs
Bitcoin is the largest cryptocurrency by market capitalization, a virtual currency designed to serve as money. This form of payment cannot be controlled by any one person, group, or entity, which eliminates the need for third-party participation during financial transactions.
Altcoins are any cryptocurrency apart from Bitcoin, but some also regard Ethereum as a non-altcoin because it is from these two cryptocurrencies that forking happens. If this is true, then Litecoin is the first altcoin, forked from the Bitcoin protocol and, therefore, an “improved” version of it.
Stablecoins are cryptocurrencies designed to have a stable price, with their value backed by a reserve of the asset it represents. To achieve this, the value of any one stablecoin is pegged to a commodity or financial instrument, such as the US Dollar (USD), with its supply regulated by an algorithm or demand. The main goal of stablecoins is to provide an on/off-ramp for investors willing to trade and invest in cryptocurrencies. Stablecoins also allow investors to store value since cryptocurrencies, in general, are subject to volatility.
Bitcoin dominance is the ratio of Bitcoin's market capitalization to the total market capitalization of all cryptocurrencies combined. It provides a clear picture of Bitcoin’s interest among investors. A high BTC dominance typically happens before and during a bull run, in which investors resort to investing in relatively stable and high market capitalization cryptocurrency like Bitcoin. A drop in BTC dominance usually means that investors are moving their capital and/or profits to altcoins in a quest for higher returns, which usually triggers an explosion of altcoin rallies.
Author

John Isige
FXStreet
John Isige is a seasoned cryptocurrency journalist and markets analyst committed to delivering high-quality, actionable insights tailored to traders, investors, and crypto enthusiasts. He enjoys deep dives into emerging Web3 tren


