Pepe Price Forecast: Pepe recovers on renewed whale interest
- Pepe is up roughly 8% so far on Thursday, extending gains above the 50-day EMA.
- Whale holding data shows a renewed interest after a distribution phase, fueling PEPE prices.
- PEPE futures Open Interest rises 20% in 24 hours, reflecting retail positional buildup.

Pepe (PEPE) extends roughly 8% gains at press time on Thursday, recovering as the broader market risk-off sentiment wanes with truce negotiations between the US and Iran. Large wallet investors, commonly called whales, are reaccumulating PEPE while the retail interest builds in the frog-themed meme coin. The technical outlook for Pepe is cautiously bullish as it remains below the long-term moving averages.
Focus shifts to Pepe as the broader market recovers
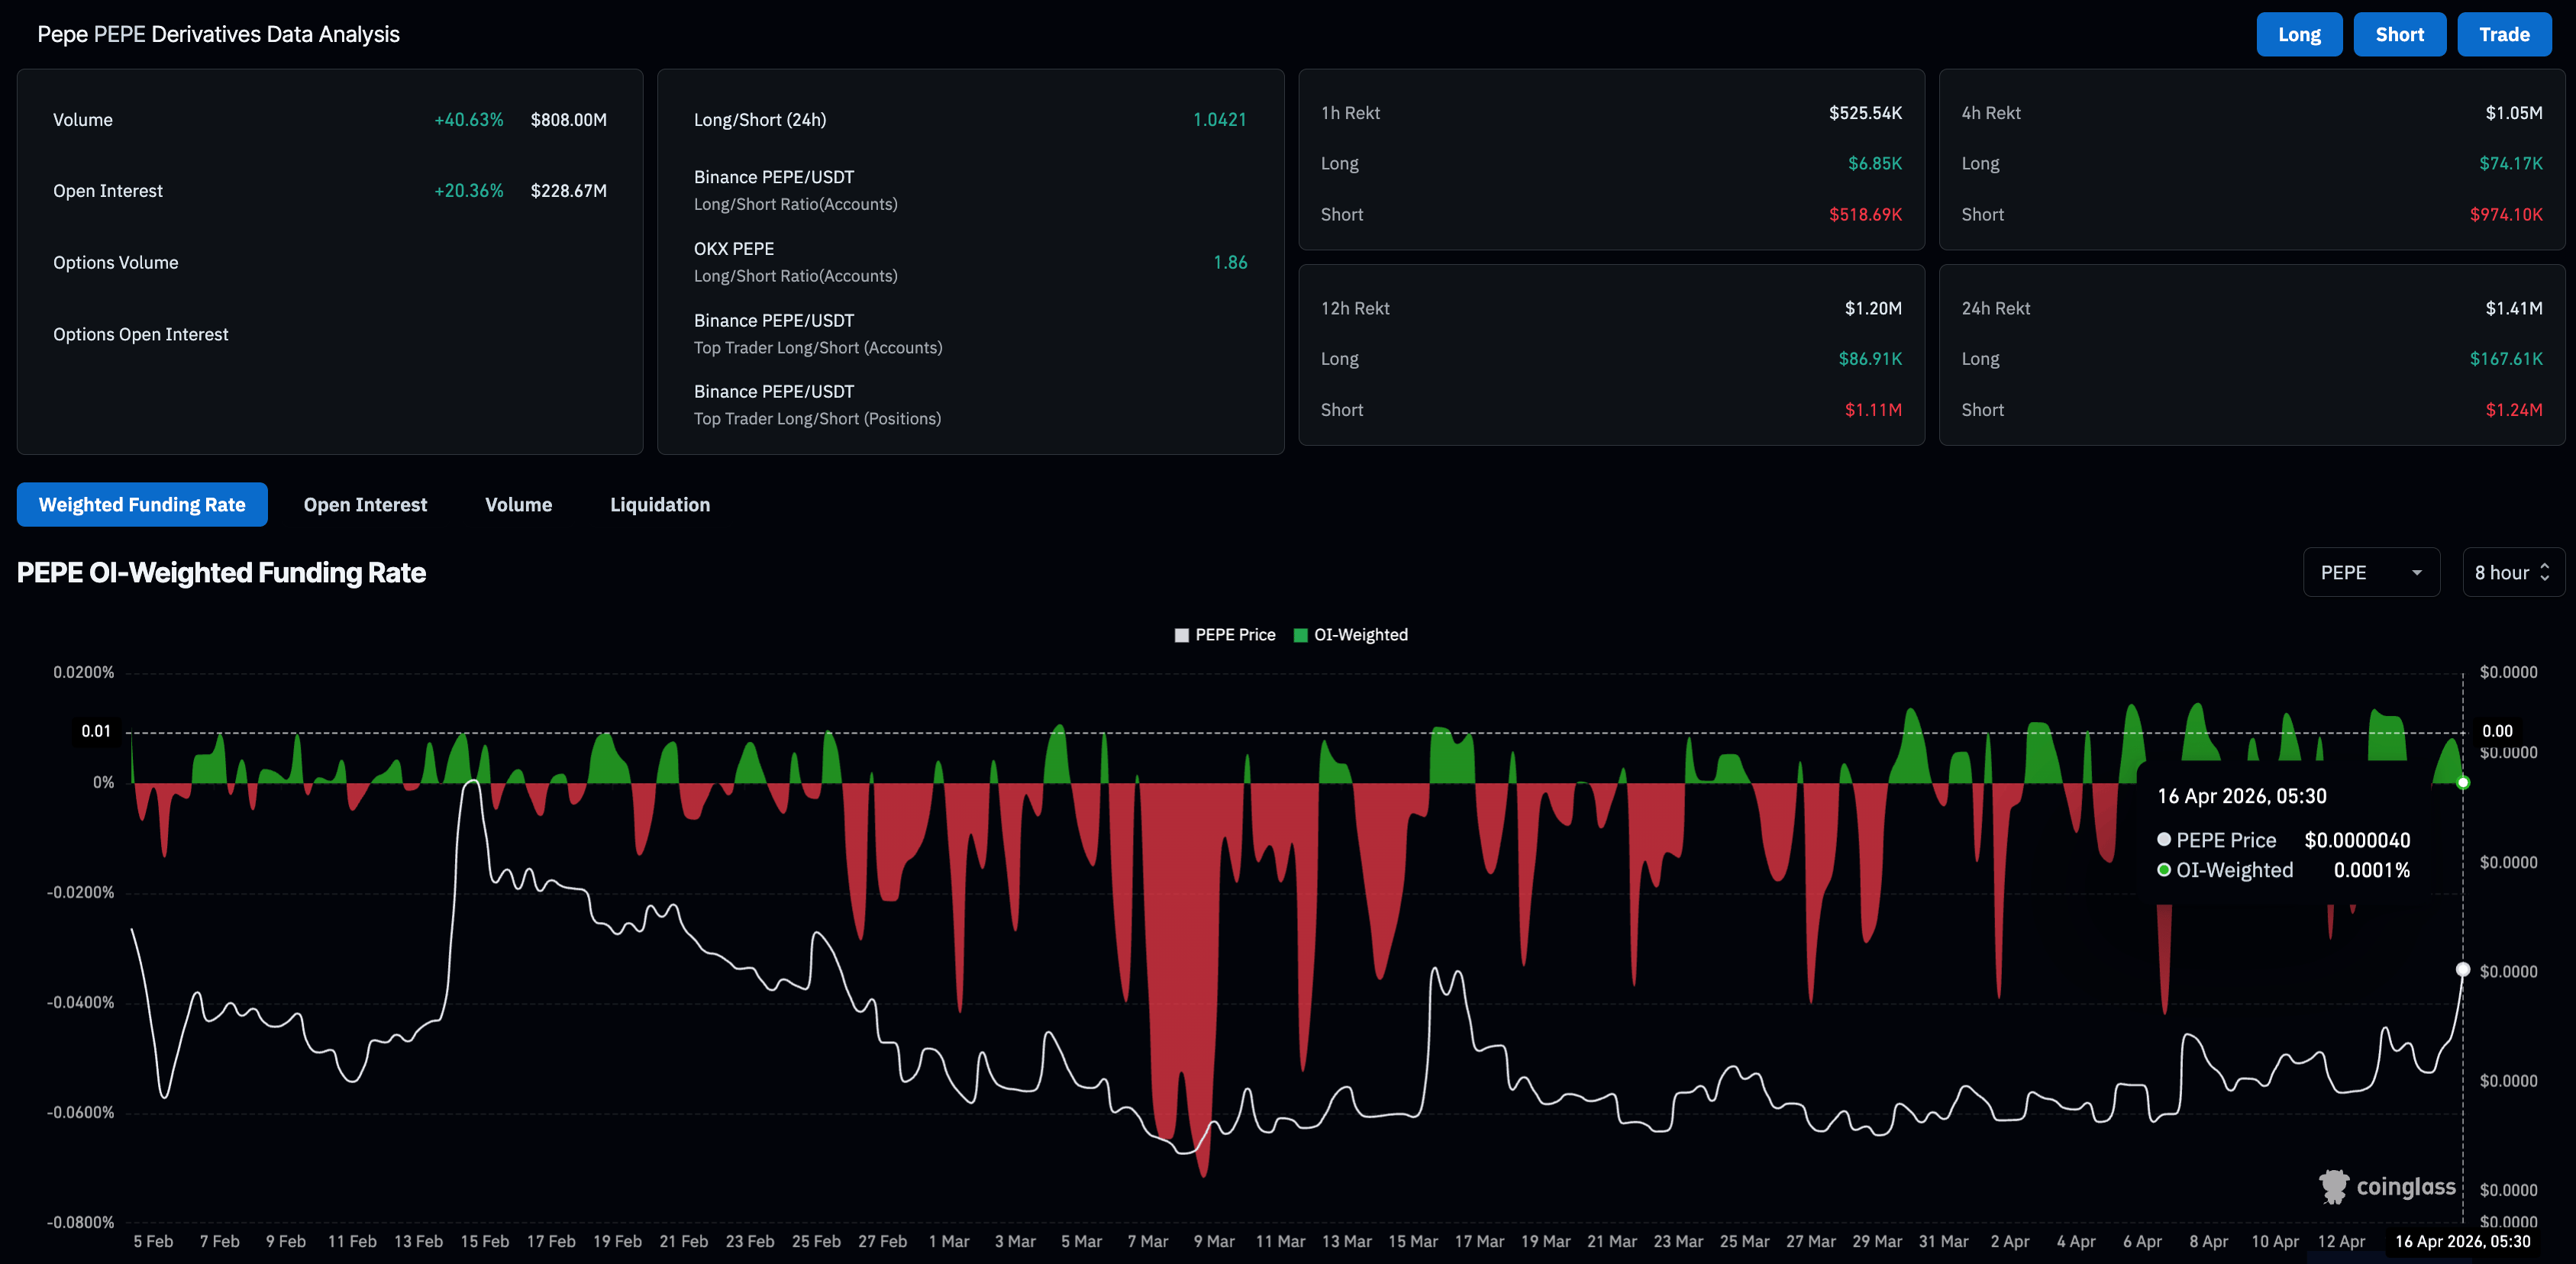
The broader cryptocurrency market recovery is building risk-on sentiment among traders, leading to renewed interest in meme coins such as Pepe. CoinGlass data shows the PEPE futures Open Interest is up 20% over the last 24 hours to $228.67 million, indicating a surge in the notional value of outstanding positions. Typically, an OI surge backing a near-term recovery reflects retail anticipation of an extended rally.
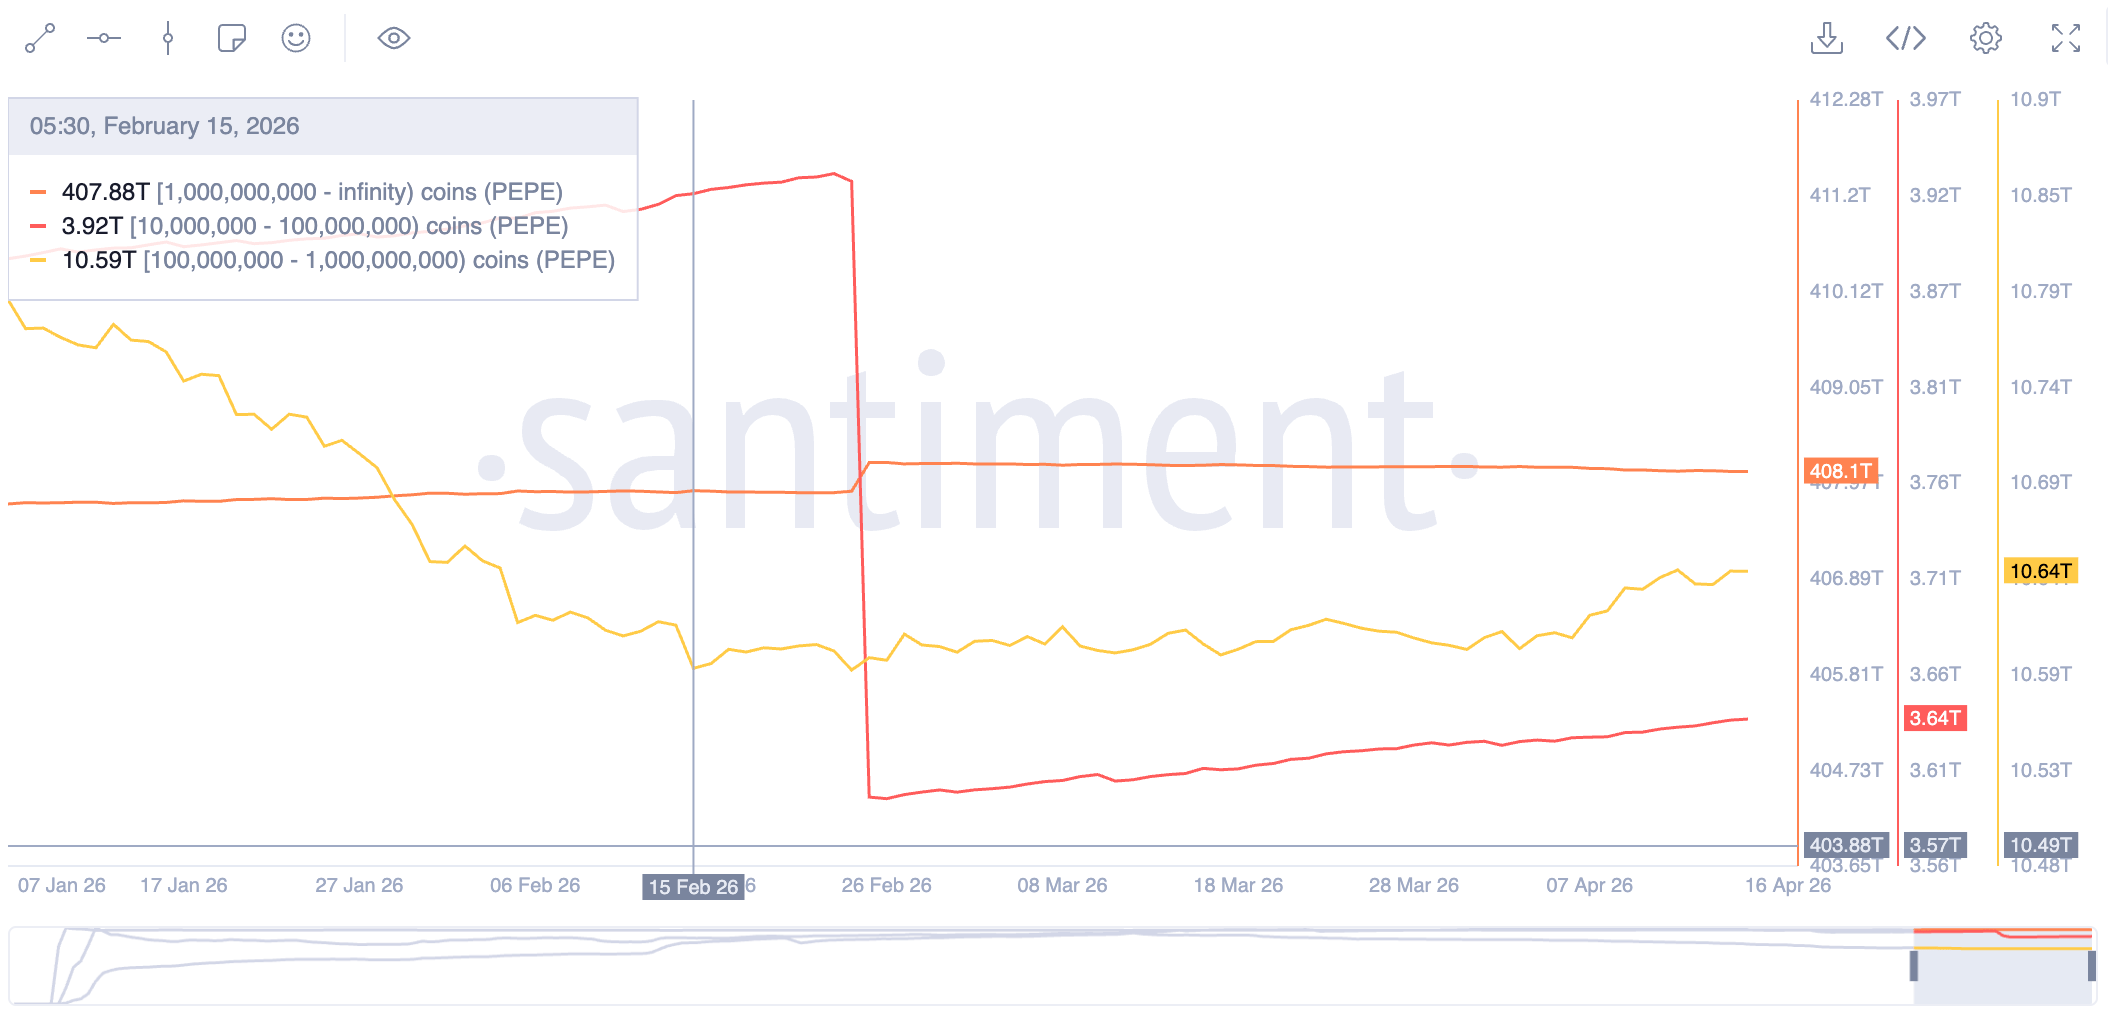
On the other hand, whales with holdings of over 100 million PEPE are rebuilding their positions, suggesting long-term upside. Santiment data shows that investors with 100 million to 1 billion PEPE tokens hold 10.64 trillion PEPE, up from 10.59 trillion on February 15.
Meanwhile, cohorts with over 1 billion PEPE now hold 3.64 trillion PEPE, up from 3.60 trillion on February 25, reaffirming the whales' interest.
Technical outlook: Will Pepe extend its rally above the 100-day EMA?
Pepe extends its second consecutive day of recovery above the 50-day Exponential Moving Average (EMA) after breaking above a descending trendline. However, the meme coin tests the 100-day EMA at $0.00000411, leaving the pair without a clear directional edge.
A decisive close above this level could pave the way toward the 200-day EMA at $0.00000550.
The Relative Strength Index (RSI) at 62 suggests mildly constructive momentum with further upside before reaching the overbought levels. Meanwhile, the Moving Average Convergence Divergence (MACD) steadies higher with its signal line in the positive territory with expanding MACD histograms above the zero line, reaffirming the bullish momentum.
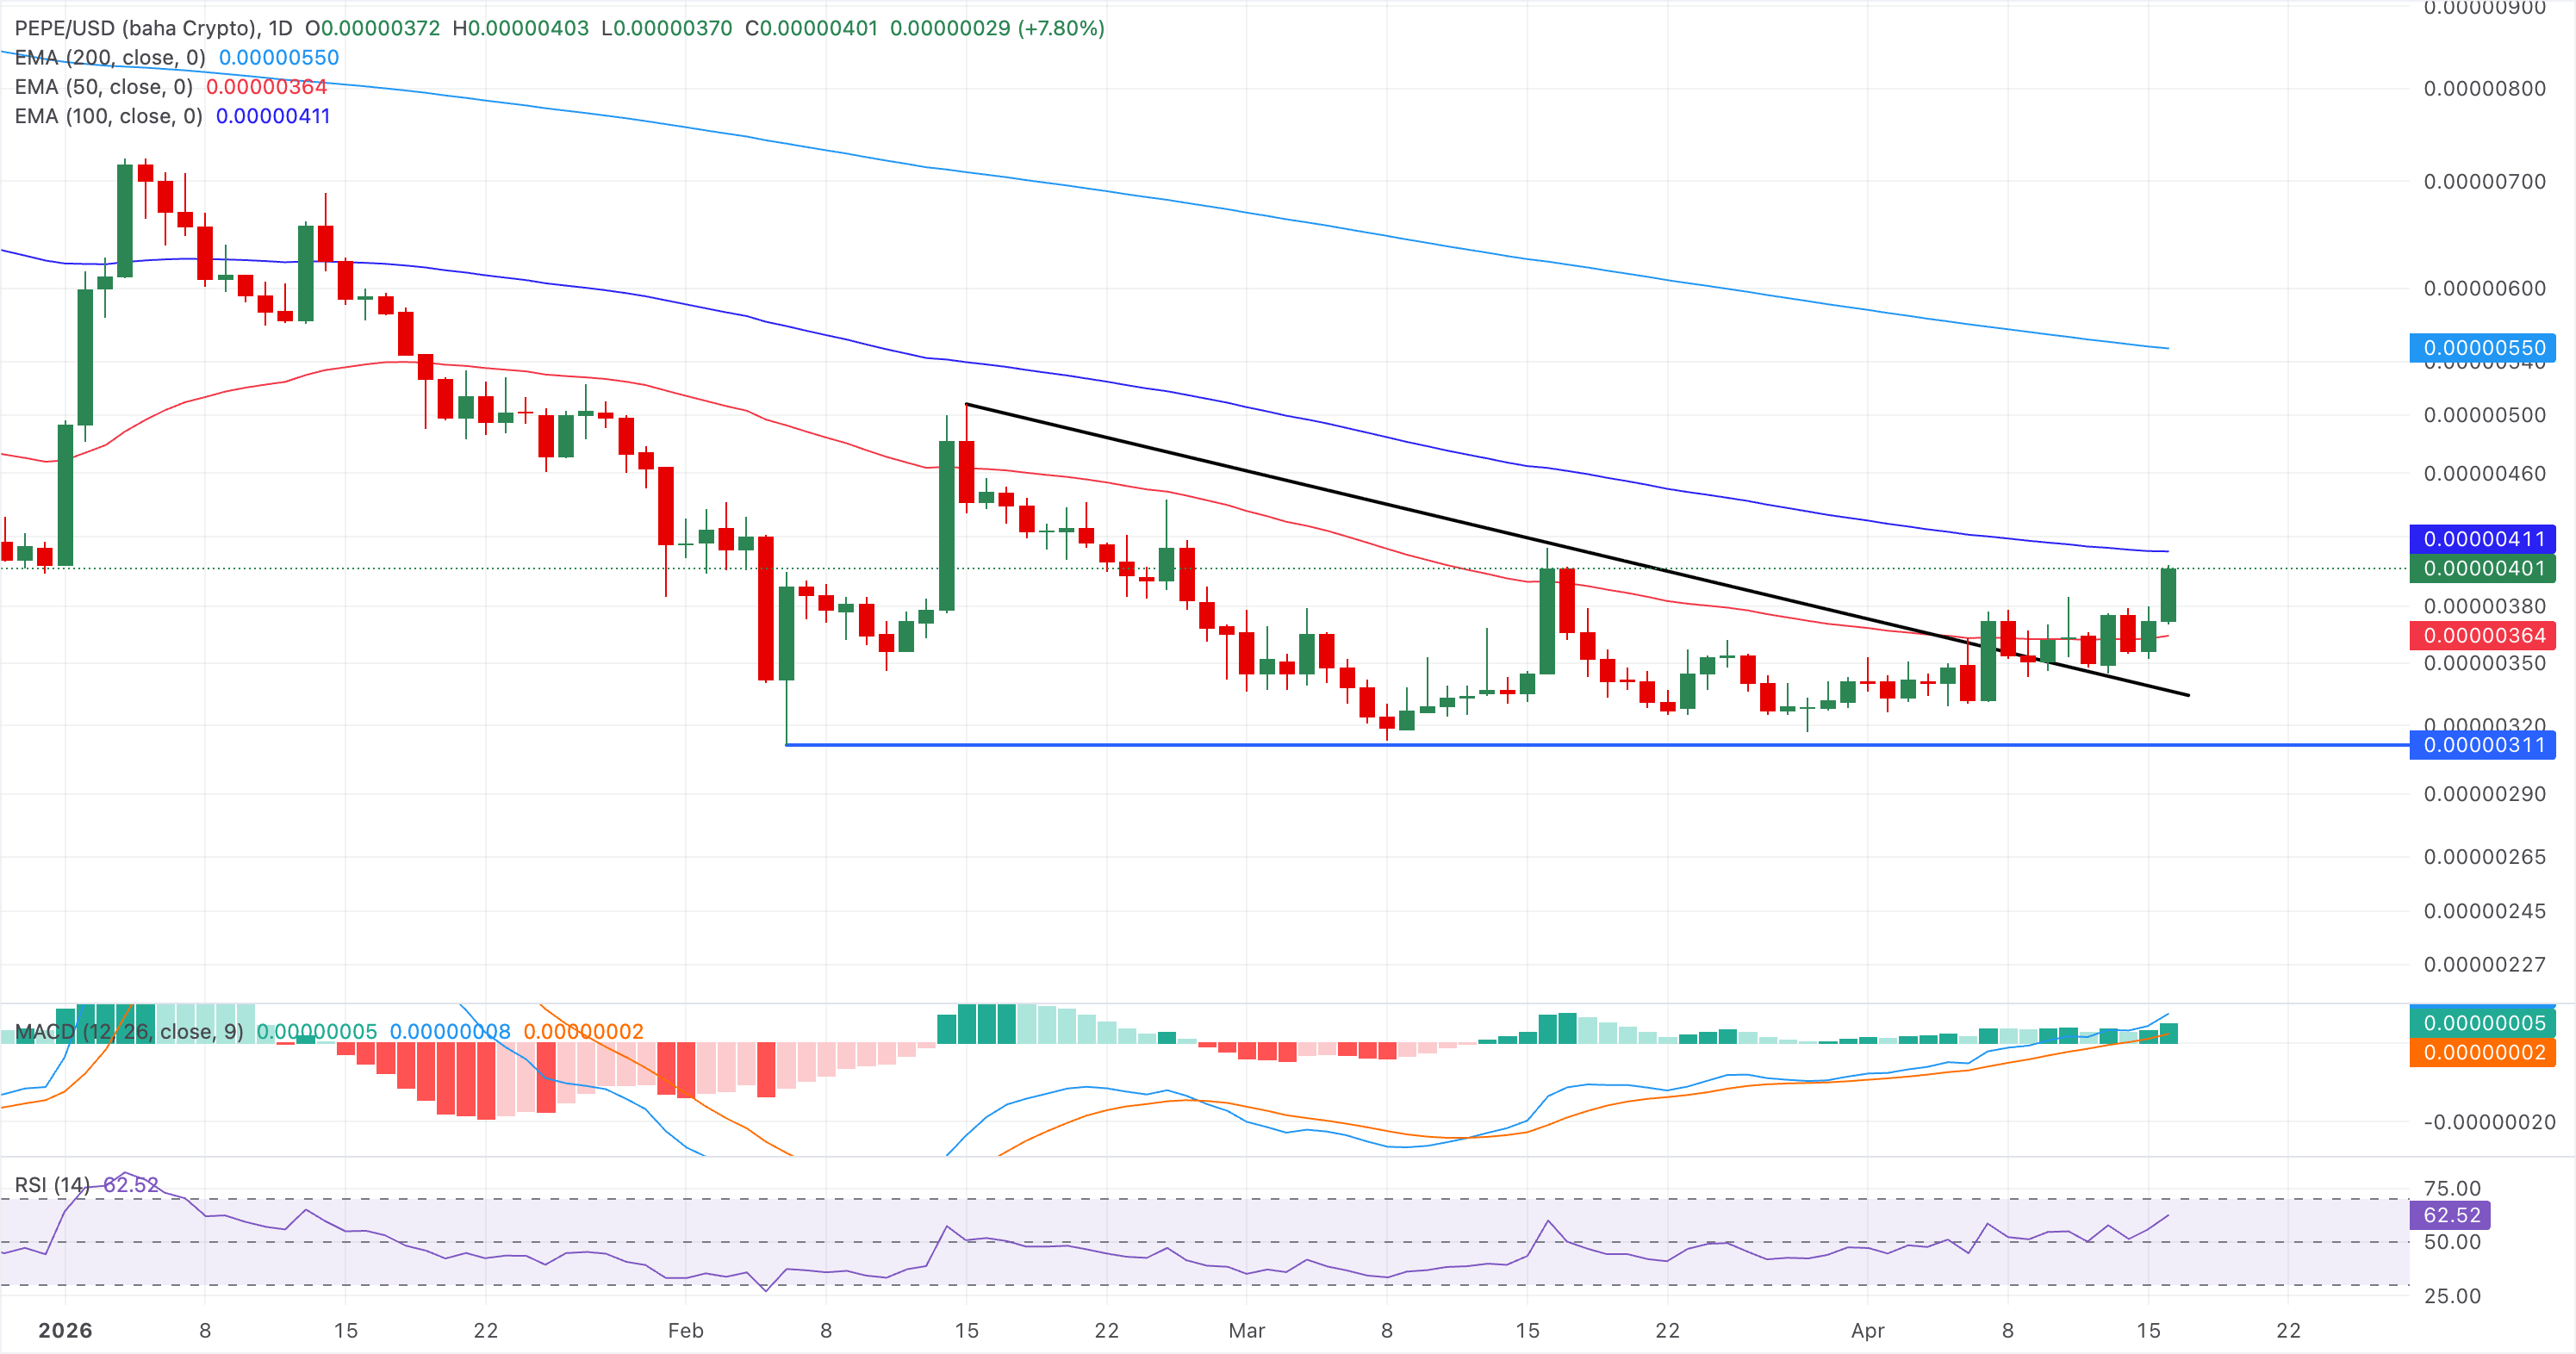
Looking down, the key support for PEPE is at the 50-day EMA, close to the broken trendline, at $0.00000364.
(The technical analysis of this story was written with the help of an AI tool.)
Author

Vishal Dixit
FXStreet
Vishal Dixit holds a B.Sc. in Chemistry from Wilson College but found his true calling in the world of crypto.