Hyperliquid Price Forecast: HYPE faces key test as bulls aim to hold the 200-day EMA
- Hyperliquid extends its correction below the $65.00 area amid weak sentiment in the broader crypto market.
- HYPE faces declining investor interest as reflected in the staking balance falling to $5.74 billion.
- The return of retail demand lifts futures Open Interest to $2.7 billion, but the impact on HYPE appears limited.

Hyperliquid (HYPE) is trading under pressure, testing support around $64.00 at the time of writing on Tuesday. This drawdown follows a limited upswing near $68.00 the previous day, undermining the short-term technical outlook.
Hyperliquid falters amid deteriorating sentiment
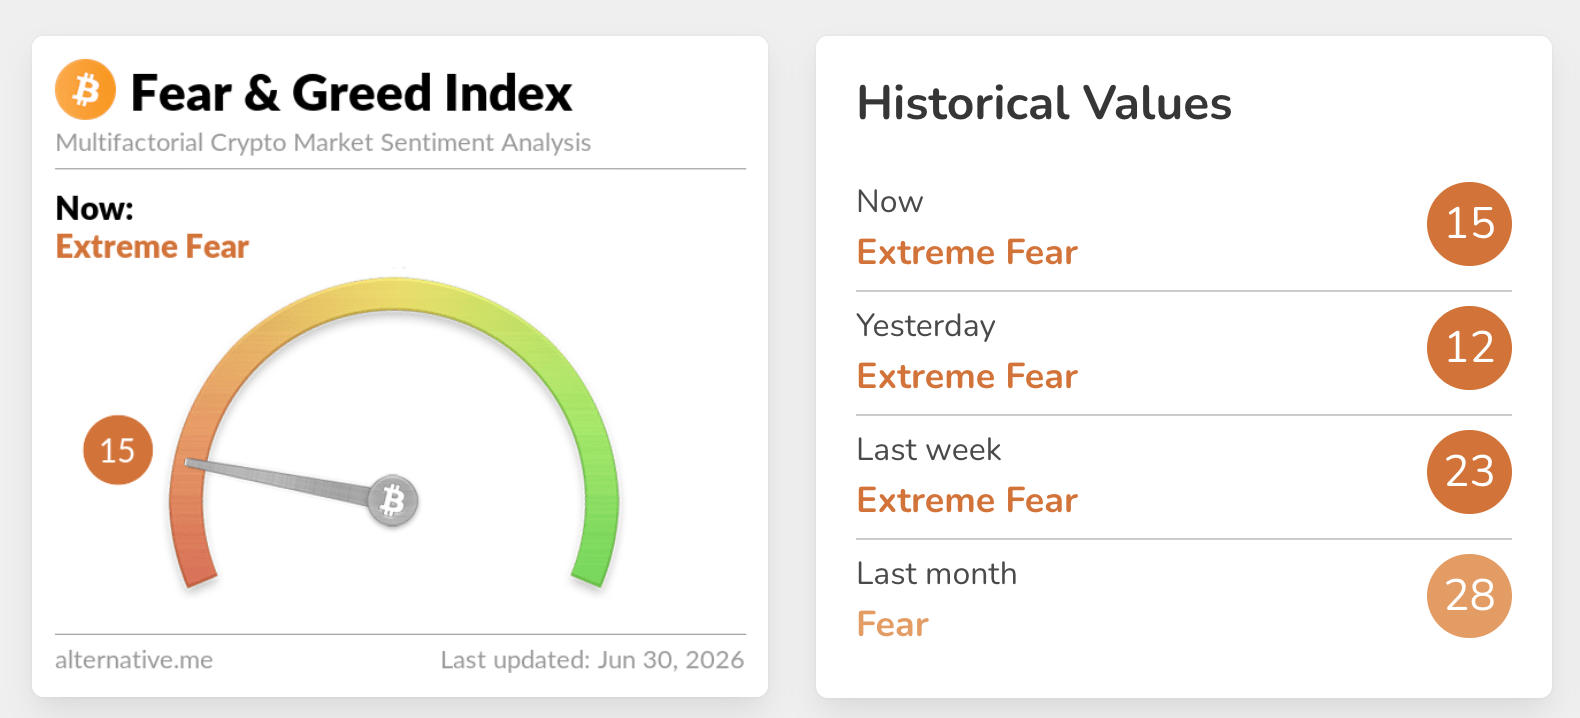
HYPE’s near-term bearish bias aligns with the persistently weak sentiment in the broader crypto market, as evidenced by the Fear & Greed Index in the Fear Territory at 15 on Tuesday, up only slightly from 12 the day before. This translates to a lack of appetite for risk assets, limiting gains and rebound potential.
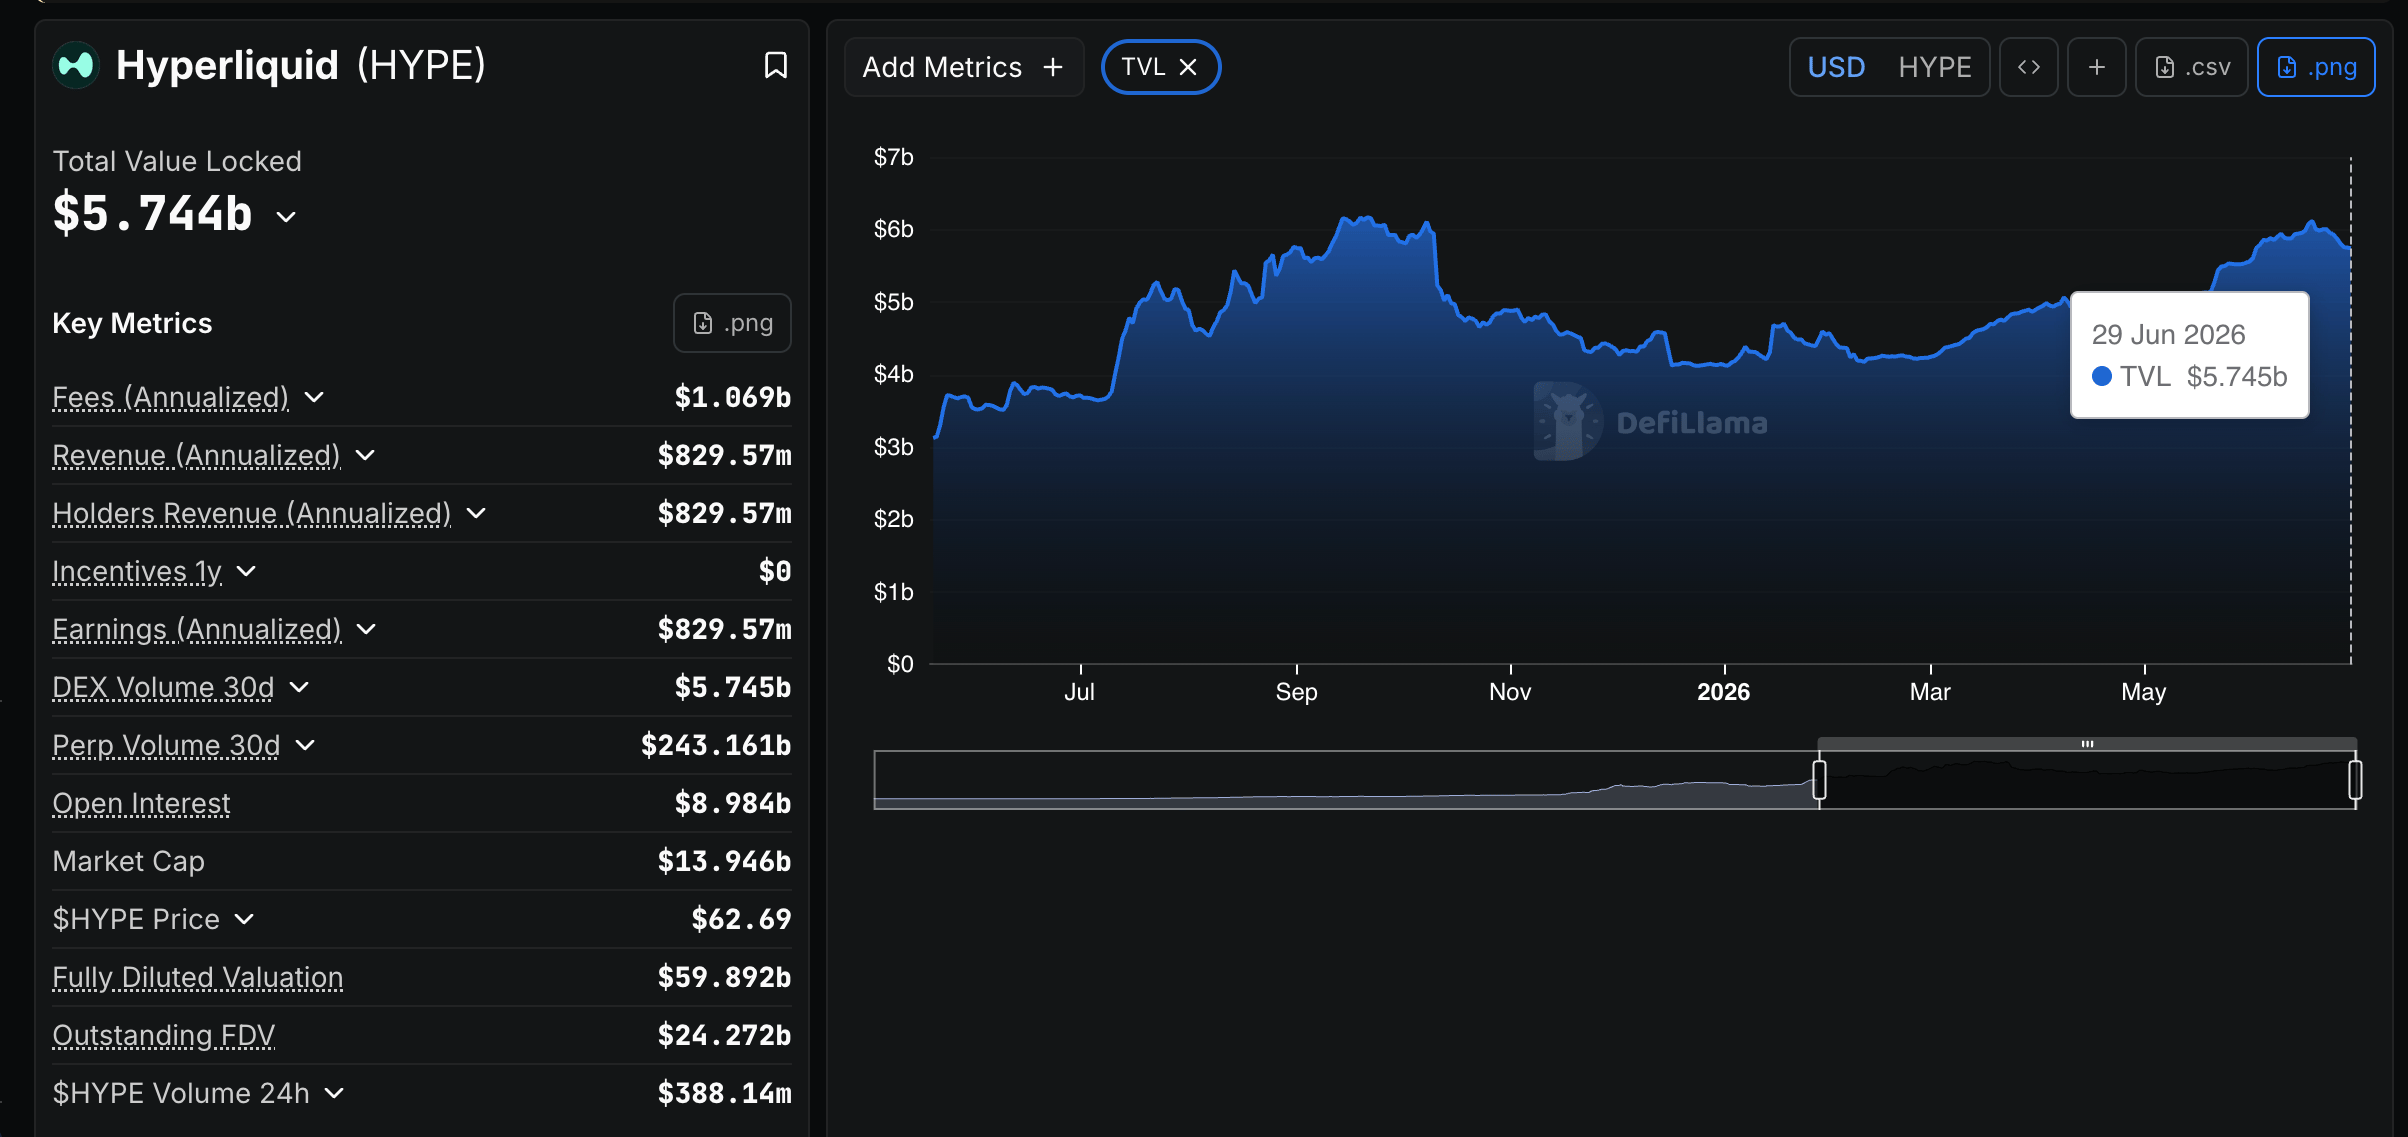
Reflecting the prevailing bearish sentiment across the broader crypto market, Hyperliquid’s Decentralized Finance (DeFi) ecosystem has seen its Total Value Locked (TVL) decline to $5.74 billion as of Monday, down from $6.12 billion on June 18.
TVL represents the aggregate value of assets deposited within a protocol’s smart contracts by network participants eyeing rewards on their HYPE holdings.
A persistent decrease in TVL signals waning investor confidence, prompting participants to scale back their exposure. Conversely, a consistent uptick in TVL would signal renewed bullish sentiment, as investors demonstrate greater willingness to allocate capital to the protocol’s smart contracts.
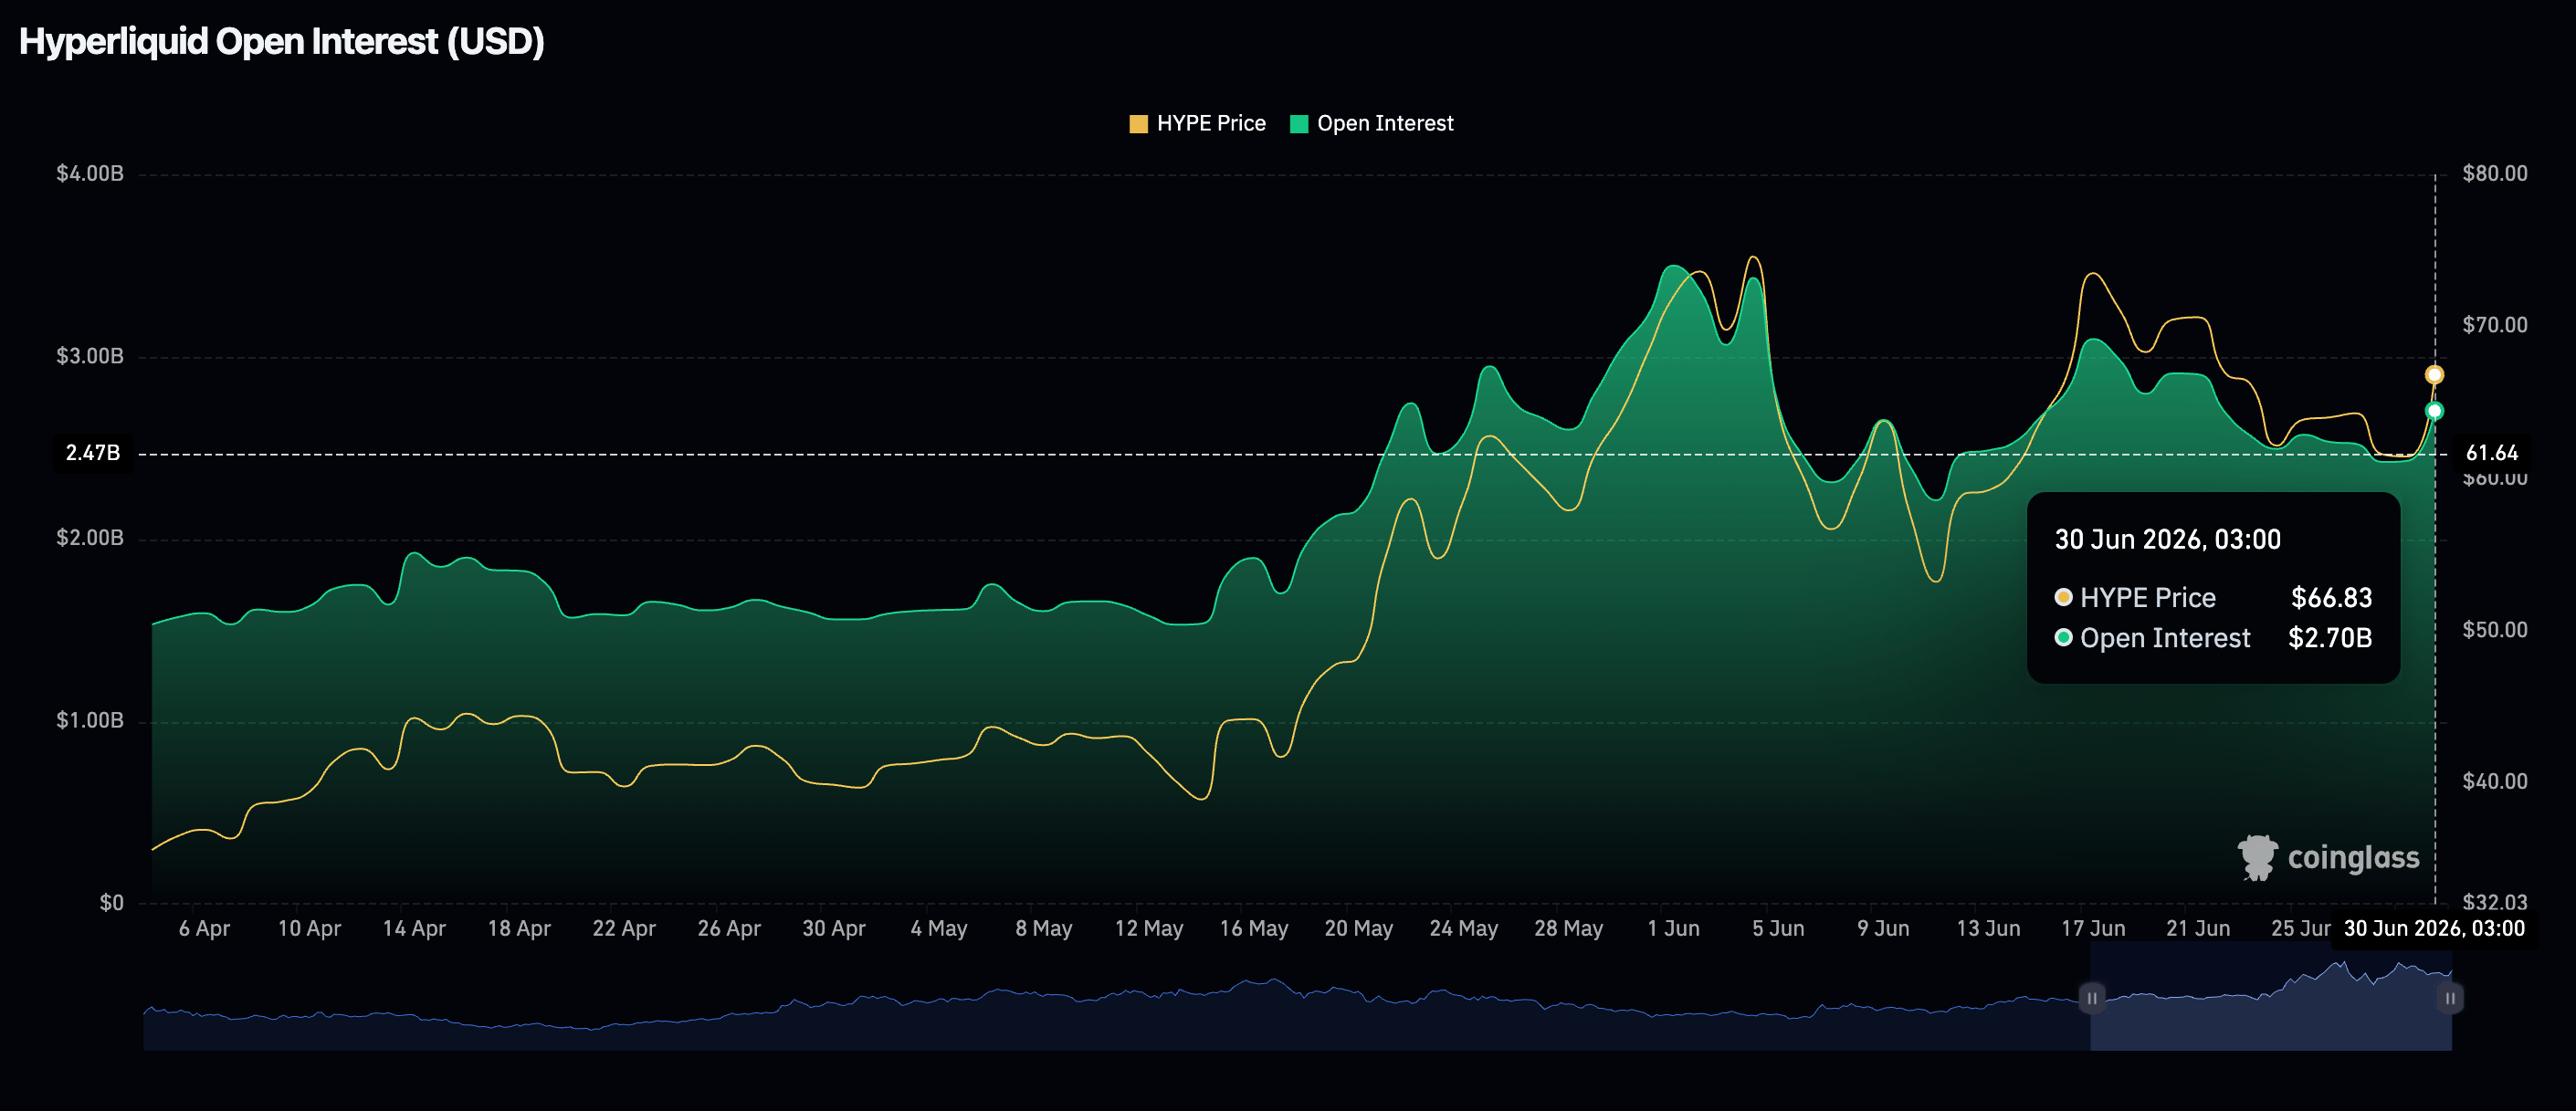
In the meantime, retail demand is gaining momentum, triggering a steady increase in the Hyperliquid perpetual futures Open Interest (OI). CoinGlass data show the OI rising to $2.7 billion on Tuesday, from $2.4 billion the day before. If sustained, demand for HYPE derivatives could absorb spot market selling pressure and help steady the rebound above $70.00.
Price analysis: Hyperliquid bulls step up to defend key support
Hyperliquid trades near $65.00, holding a mildly bullish near-term bias as it remains above the 50-day, 100-day and 200-day Exponential Moving Averages (EMAs). The spot price trades over the short and medium-term EMAs at $64.44 and $64.53, respectively, while the longer-term 200-day EMA at $62.63 offers a deeper layer of trend support, suggesting the recent recovery is backed by a constructive underlying structure.
Momentum remains relatively supportive, with the Moving Average Convergence Divergence (MACD) histogram in positive territory on the daily chart. The Relative Strength Index (RSI) hovers near 53 on the same chart, indicating steady buying interest without stretching into overbought conditions.
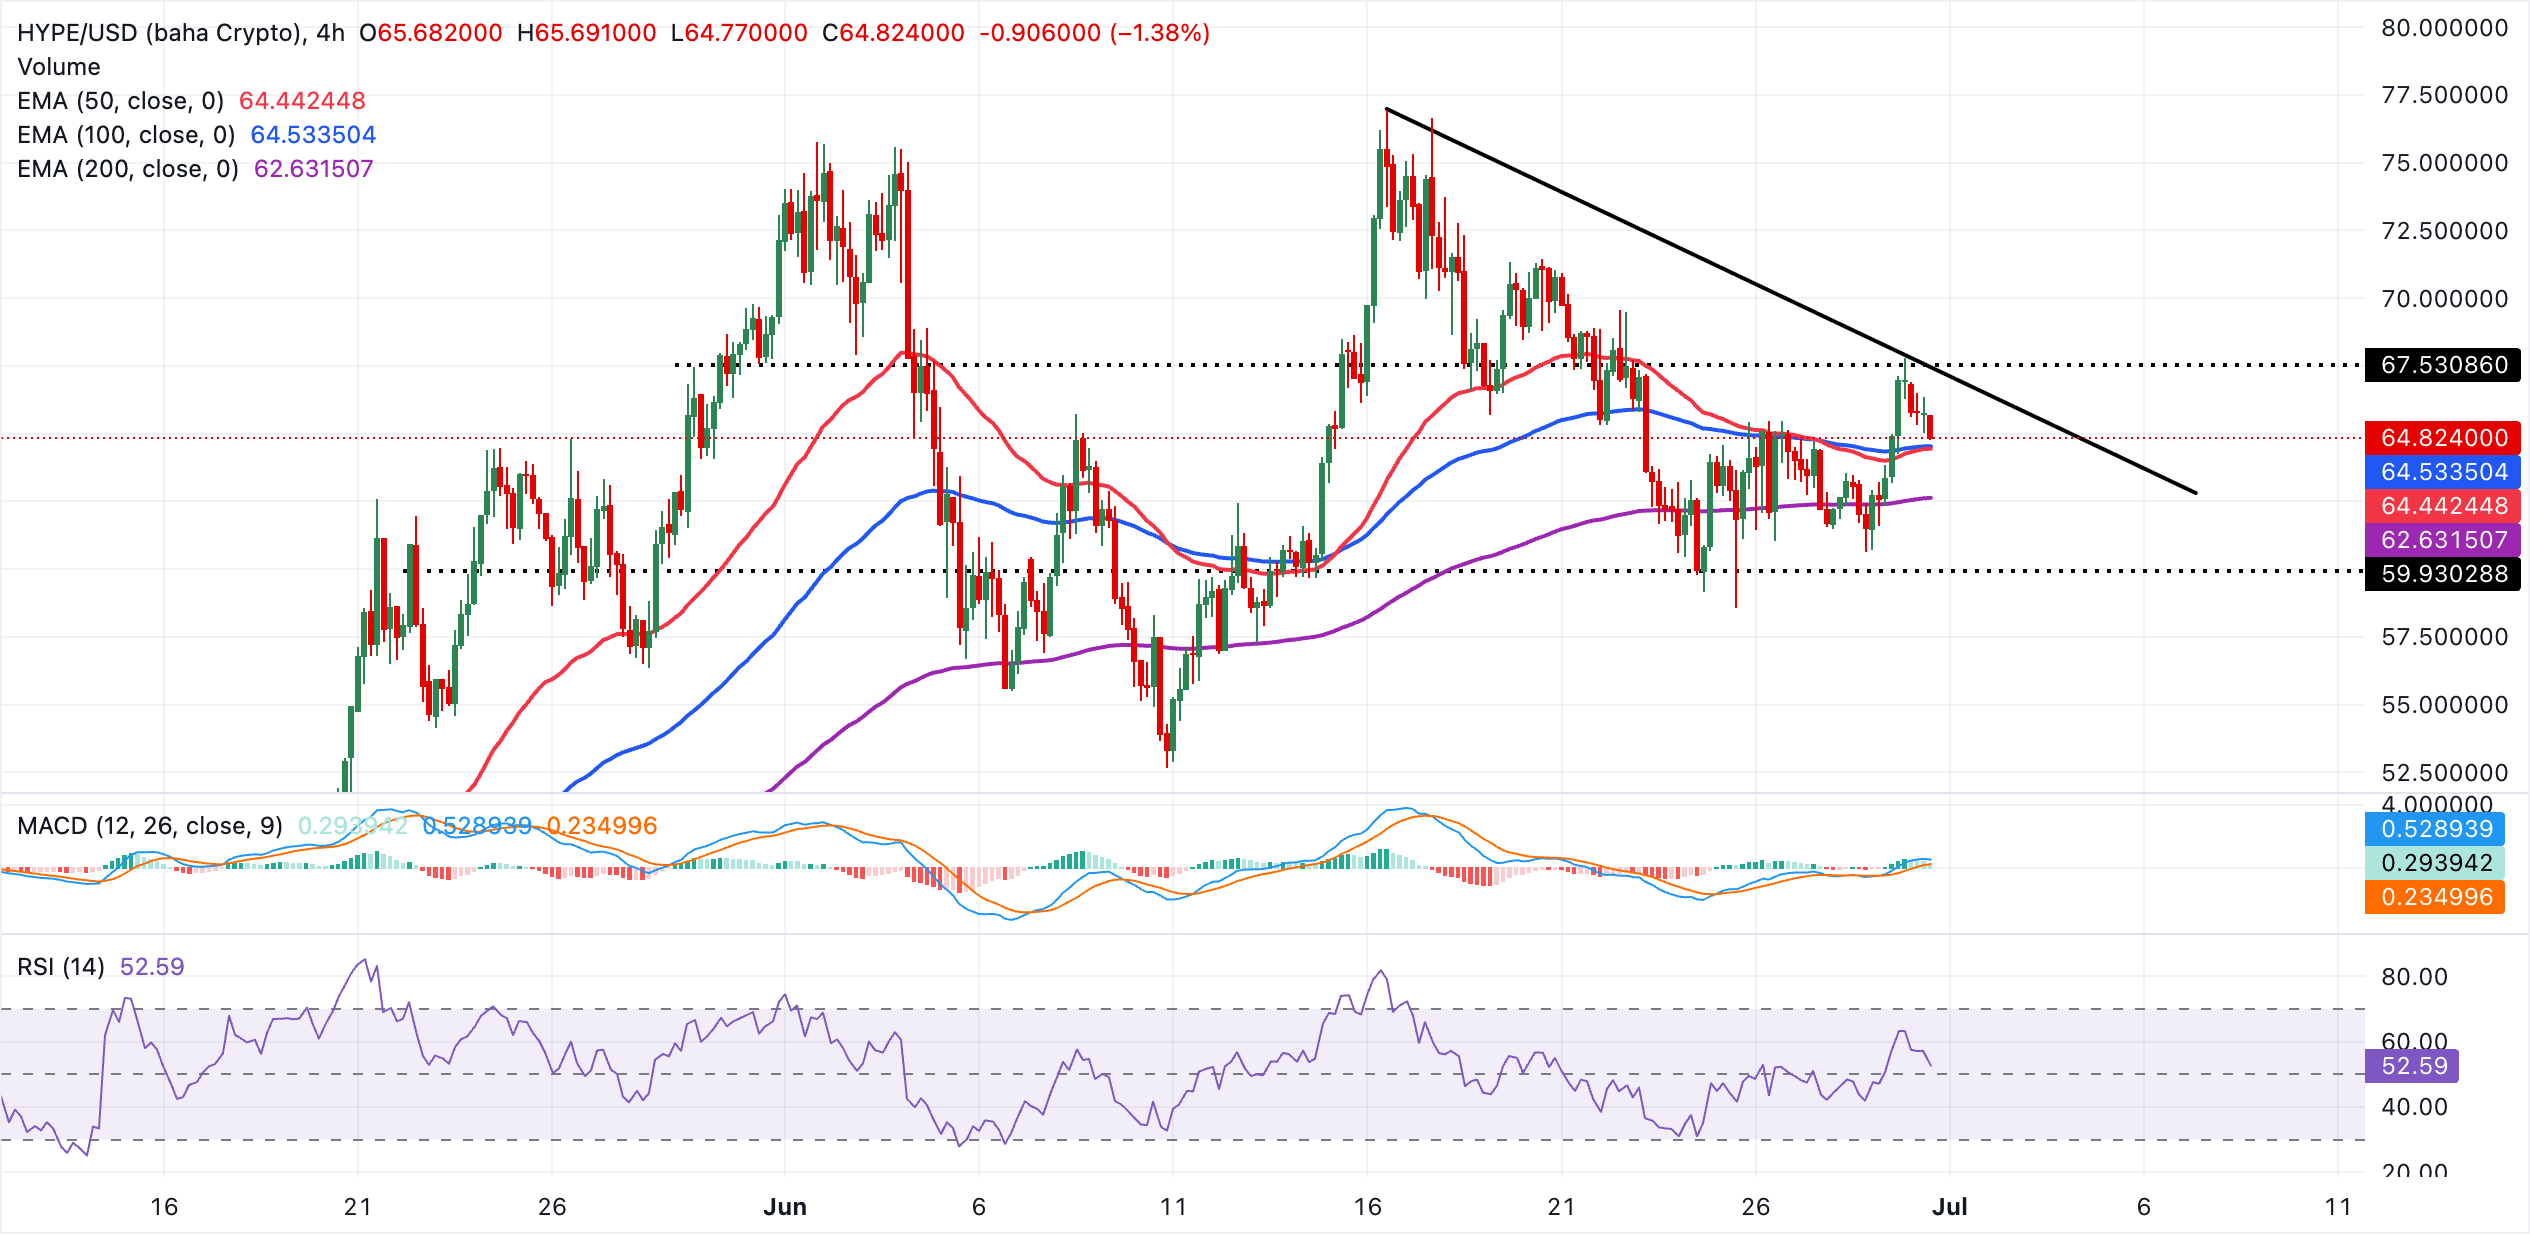
On the downside, immediate support lies near the clustered band of short and medium-term EMAs at $64.53 and $64.44, where a pullback could attract dip buyers as long as HYPE defends this zone. A deeper slide would expose the 200-day EMA at $62.63 as the next key floor area, whose loss would materially weaken the bullish bias and open the door to a broader corrective phase. Potential buy-the-dip demand could moderate the losses at the current level or near the 200-day EMA, paving the way for gains toward the descending trendline resistance at $67.50 and the next key psychological barriers at $70.00 and $75.00.
(The technical analysis of this story was written with the help of an AI tool.)
Open Interest, funding rate FAQs
Higher Open Interest is associated with higher liquidity and new capital inflow to the market. This is considered the equivalent of increase in efficiency and the ongoing trend continues. When Open Interest decreases, it is considered a sign of liquidation in the market, investors are leaving and the overall demand for an asset is on a decline, fueling a bearish sentiment among investors.
Funding fees bridge the difference between spot prices and prices of futures contracts of an asset by increasing liquidation risks faced by traders. A consistently high and positive funding rate implies there is a bullish sentiment among market participants and there is an expectation of a price hike. A consistently negative funding rate for an asset implies a bearish sentiment, indicating that traders expect the cryptocurrency’s price to fall and a bearish trend reversal is likely to occur.
Author

John Isige
FXStreet
John Isige is a seasoned cryptocurrency journalist and markets analyst committed to delivering high-quality, actionable insights tailored to traders, investors, and crypto enthusiasts. He enjoys deep dives into emerging Web3 tren