Hyperliquid Price Forecast: Breaks rising trendline as bearish signals build
- Hyperliquid price extends correction on Tuesday, breaking below the rising trendline support.
- Derivatives data backs bearish outlook, with HYPE’s funding rates turning negative and short bets climbing to their highest level.
- The technical outlook flashes early signs of weakening momentum, suggesting the correction could continue in the near term.

Hyperliquid (HYPE) extends its pullback, trading below $42 as of writing on Tuesday, breaking beneath its rising trendline support. Weakening derivatives metrics support the bearish price action. On the technical side, momentum indicators signal early signs of weakness, suggesting a near-term correction.
Derivatives data supports a bearish bias
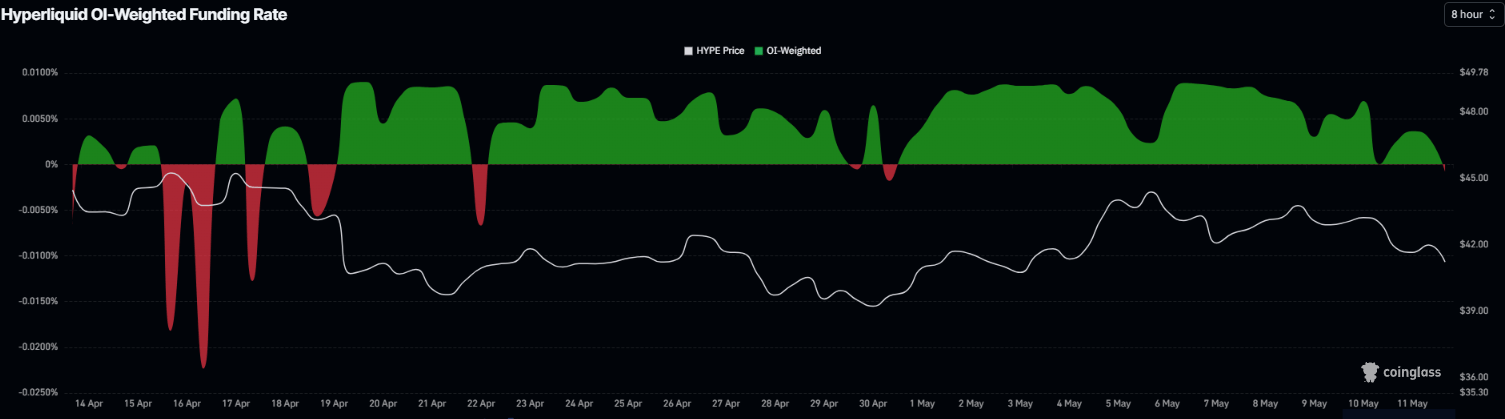
Hyperliquid derivatives metrics show a bearish outlook. CoinGlass’ OI-Weighted Funding Rate data for HYPE turns negative, reading -0.0008% on Tuesday, indicating shorts are paying longs and projecting a bearish sentiment.
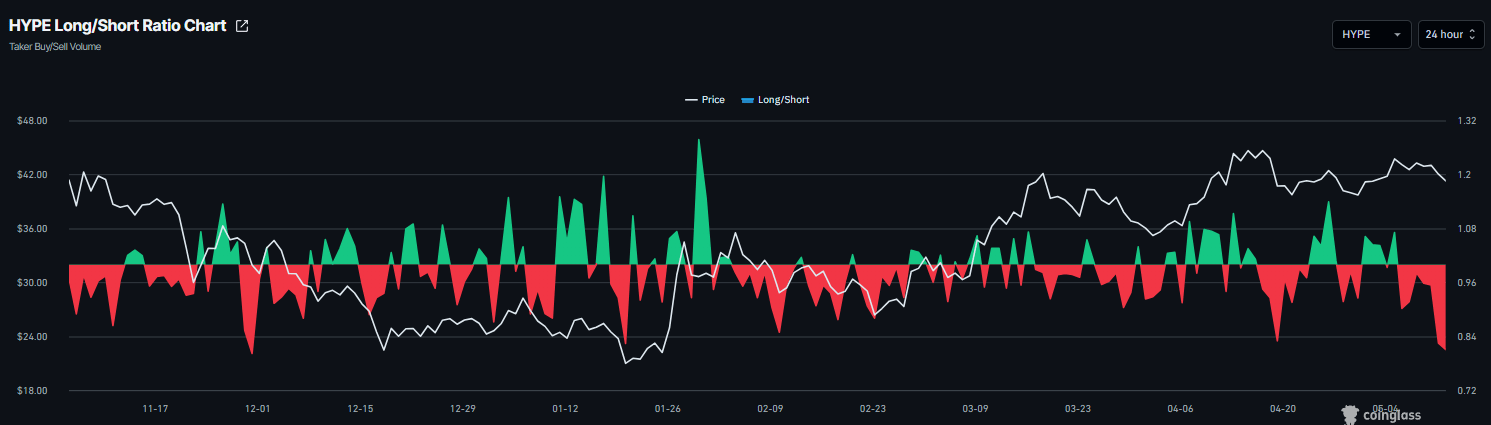
In addition, CoinGlass’ long-to-short ratio for HYPE reads 0.81 on Tuesday, the lowest level over a month. This ratio, being below one, further reflects bearish sentiment in the market, as more traders are betting on the asset price to fall.
Some signs of optimism
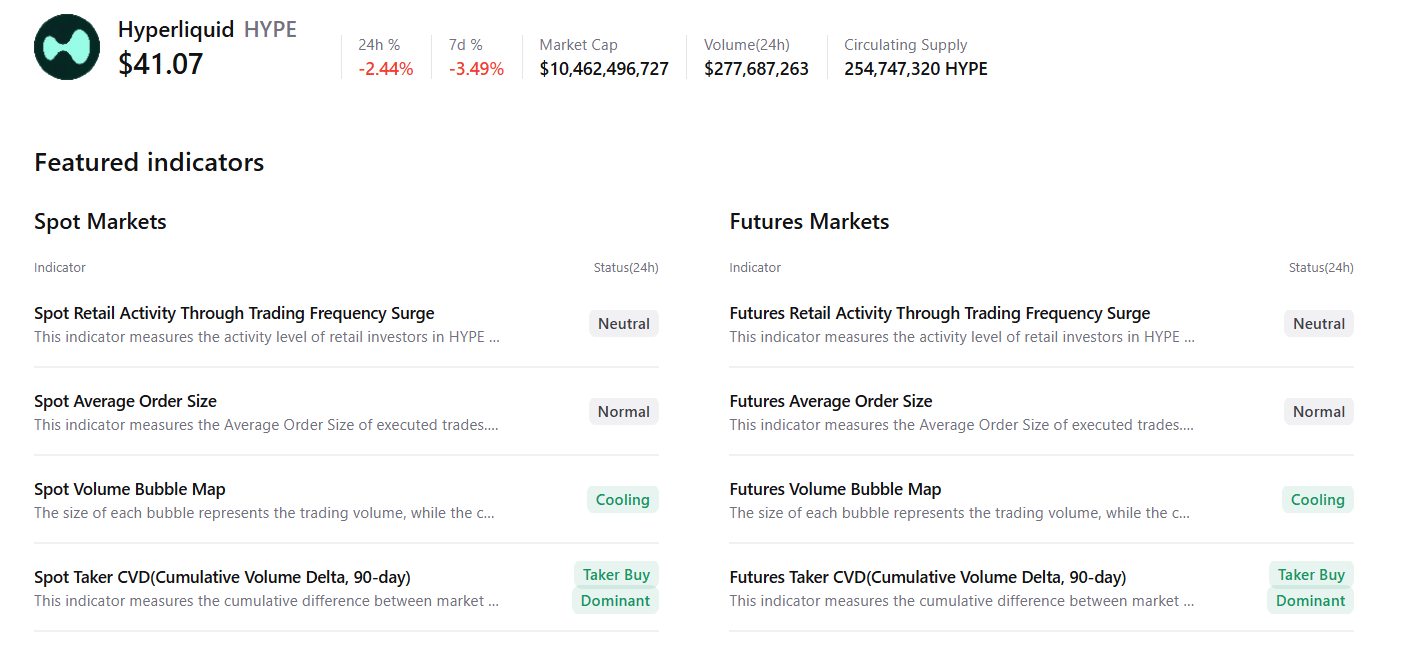
Apart from the bearish sentiment in the derivatives, CryptoQuant summary data suggests a neutral to slightly bullish outlook for HYPE. Spot and futures markets show cooling conditions and buy-side dominance, with mostly neutral conditions across other metrics, supporting a potential recovery.
Hyperliquid Price Forecast: Momentum indicators flash early bearish signs
Hyperliquid price is breaking below the rising trendline (drawn by connecting multiple highs since the end of January), trading at $41.25 on Tuesday after correcting 2.35% the previous day.
If HYPE closes below this trendline support, roughly around $42.17 on a daily basis, it could extend the correction toward the 50-day Exponential Moving Average (EMA) at $40.30. A close below this level could extend losses toward the 100-day and 200-day EMA at $37.87 and $36.05, respectively.
Momentum indicators are also flashing early signs of weakness. The Relative Strength Index (RSI) on the daily chart reads 48, slipping below the neutral level, and the Moving Average Convergence Divergence (MACD) indicators on the same chart showed a bearish crossover on Monday, projecting a negative outlook.
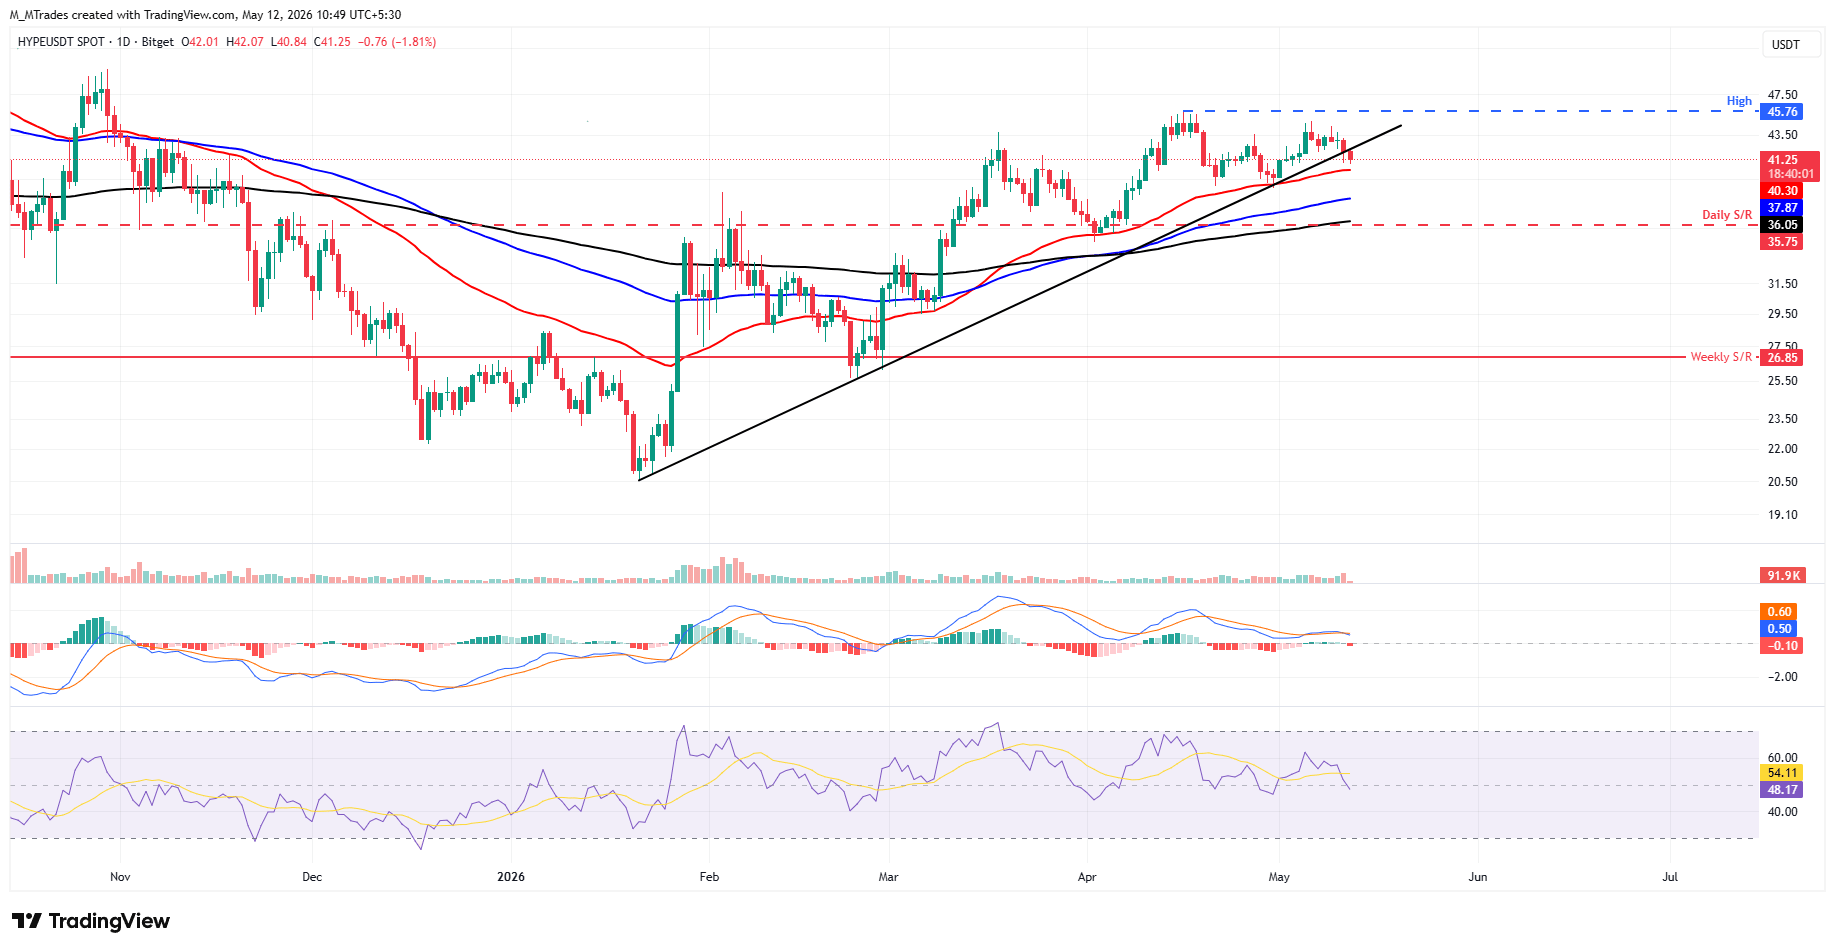
If Hyperliquid recovers, it could extend the advance toward the April 16 high of $45.76.
Author

Manish Chhetri
FXStreet
Manish Chhetri is a crypto specialist with over four years of experience in the cryptocurrency industry.




