For the doubters and the dreamers: A market still standing between headlines
- Positioning has reset, not broken — fast money de-risking has flipped the asymmetry from downside pressure to a more balanced, two-sided tape.
- Credit is the signal, not the noise — tight IG spreads tell you the system is still functioning and risk appetite hasn’t cracked.
- In headline-driven markets, edge is thin — focus on liquidity, manage gross exposure, and define risk rather than chasing conviction.

A market still standing between headlines
I do miss being on the regular Goldman list — especially reading Tony Pasquariello’s notes — but bits are finding their way back, and this latest one is worth a quick pass along.
His message is simple: strip it back.
The S&P 500 is up 5% off last week’s lows and only 4% below late February levels. For all the noise, the market hasn’t lost faith in growth. Goldman is still running +2.3% US GDP for 2026 — basically trend — and that’s enough to keep the engine turning.
Earnings are the other leg. With reporting season about to kick off, expectations are drifting higher, not lower — and that matters more than headlines.
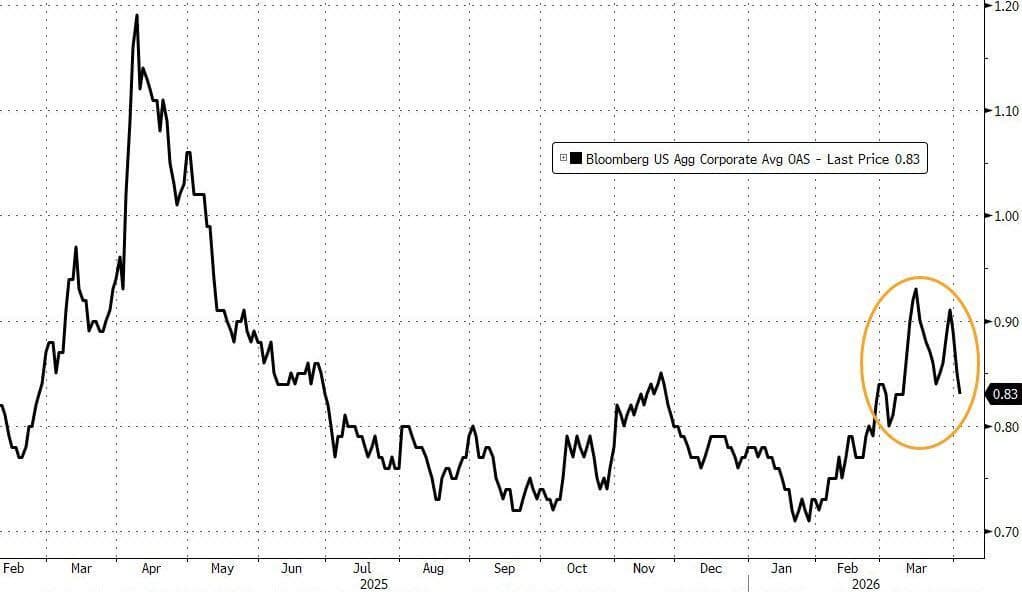
But the real tell sits in credit. US IG spreads — LUACOAS — have tightened through volatility and heavy supply. That’s not a market under stress; that’s a market still being funded.
Bottom line — the tape isn’t trading fear. It’s trading resilience.
As flagged last week, positioning has already done a lot of the heavy lifting.
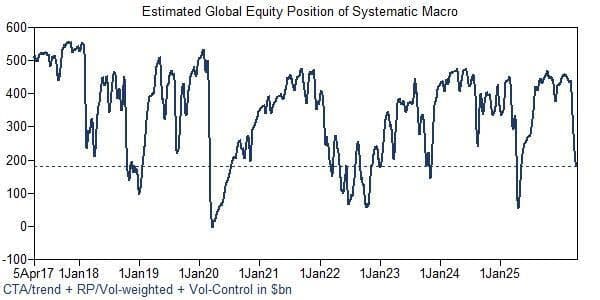
The street came into March long and left it a lot lighter. Length has been cut, exposure trimmed, and the froth taken out. That’s why the technical backdrop is quietly improving beneath the surface.
On the fundamental flow side, GS prime — again via Tony Pasquariello’s lens — shows seven straight weeks of net selling, dragging exposure down to the 31st percentile on a three year lookback. That’s not crowded anymore. That’s reset.
At the same time, the systematic crowd has dumped a meaningful amount of length. CTAs and vol targeting funds have de risked into the drawdown, leaving the market in a very different place than it was a month ago.
Put it together and the setup flips.
When positioning is heavy, rallies need a story. When positioning is light, rallies can run on air. The baseline shifts to net buying, and the asymmetry tilts higher.
In other words, the market doesn’t need good news — it just needs less bad.
There’s also a subtle shift under the hood — with March now behind us, some gamma has rotated back into the hands of market makers, helping stabilize the tape at the margin.
It’s not a perfect setup. Buybacks are still sidelined until the end of the month, so a steady corporate bid isn’t there yet. But that’s not the story anyway — this has been about fast money getting smaller. Hedge funds had a tough March, no question, but the key is they acted. Risk was cut, books were cleaned up, and positioning reset.
And zoom out, Q1 tells a different story. Hedge funds, on aggregate, actually delivered — roughly +2% — while the classic 60 40 mix slipped around -2%, and even the so called “safe assets” didn’t provide cover when it mattered most. That’s not just performance — that’s relevance.
But maybe the cleanest explanation is the simplest one.
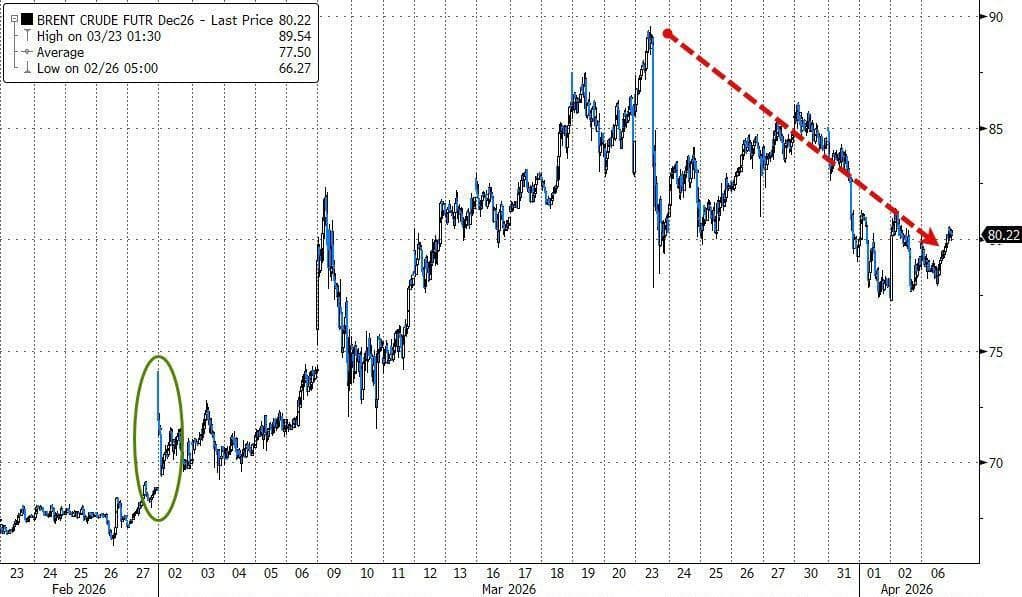
Oil stopped going up.
Deferred Brent — think COZ6 — is down about 6% from the March 20 highs. And when the barrel backs off, the pressure valve on inflation expectations eases, rates calm down, and risk assets can breathe again.
Sometimes it’s not about flows, or gamma, or positioning.
Sometimes it’s just the price of oil letting the market exhale.
…or maybe this isn’t unusual at all — maybe this is the playbook.
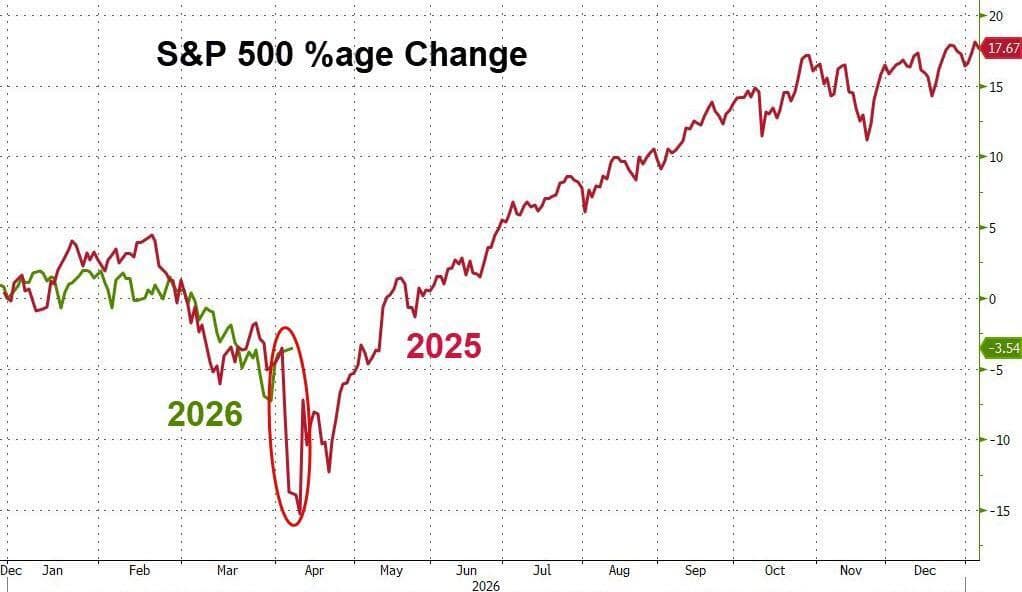
Because if you go back and look at years like 2018 or 2022, the S&P 500 didn’t go down in a straight line. It bounced — hard, repeatedly — with multiple 5% squeezes that looked and felt like turns, only to fade again.
That’s the nature of difficult tapes. They don’t trend cleanly. They whipsaw conviction.
And that’s the point.
These counter trend rallies aren’t anomalies — they’re features of a market still searching for equilibrium, where positioning resets, macro uncertainty lingers, and every rally forces participants back into risk whether they trust it or not.
Of course, context matters.
Last year’s resilience only came after a proper washout — a full blown reset that cleared the deck before the market found its footing again.
So the question isn’t whether a 5% bounce means something.
It’s whether the market has actually paid the price needed to sustain it.
Ex post, you can make a case for all of it — and that’s precisely the trap. Trading geopolitics from the short side is a low-visibility game where the headline, not the thesis, sets the price.
A month ago, the asymmetry clearly leaned lower. Today, it feels far more two-sided. The concern around physical commodity markets — especially oil — hasn’t gone away, but positioning has reset and the tape is no longer one-way.
So now it becomes a scenario tree.
The real question is whether you have any edge on which of those paths prints. Instinct is one thing — edge is another. And right now, edge feels thin.
Which brings it back to discipline.
You can’t control the headline, only your reaction to it.
So keep risk where you can exit — first-order liquidity matters. Trim gross where momentum has been erratic. And if you want to lean long, express it with defined risk — call spreads, not outright hero trades.
Because by the time clarity arrives, the move will already be underway.
For the doubters, the market is still fragile.
For the dreamers, it’s still standing.
For everyone else, it’s a tape that demands respect more than conviction.
For the doubters
This is our “US geopolitical risk basket” relative to the S&P 500...
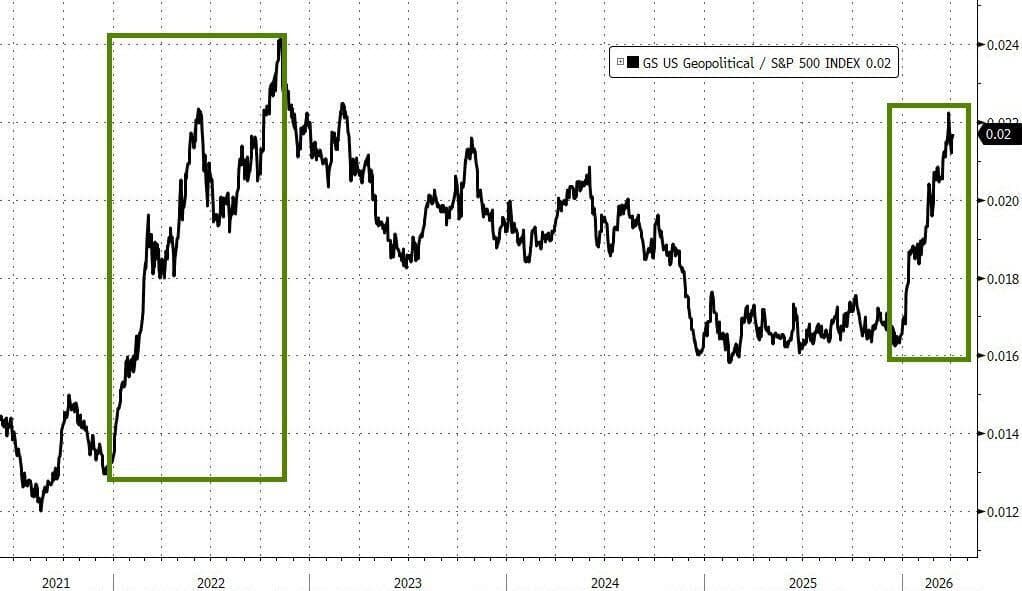
Think defense contractors, oil producers and tankers.
As it did in 2022, this portfolio is doing what it should be doing... outperforming and making a higher high.
For the Dreamers:
This simply plots 12-month forward earnings estimates for S&P 500.
As mentioned last week, this has only been increasing throughout the recent turbulence (and, bigger picture, note a near doubling since the COVID era began).
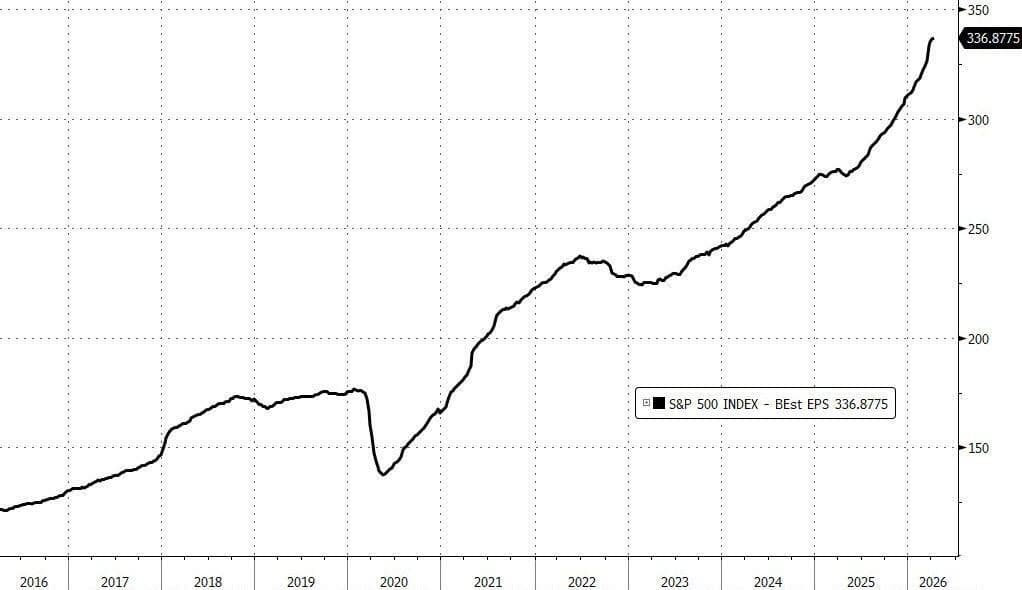
My point here: if you want to be a serious bear, you need to be willing to call in inflection lower here to make real money.
And then he zooms out — way out — to remind you how often the market gets the big picture wrong.
Digging through old notes, Tony Pasquariello flags a 2009 view that China would overtake the United States by 2027 at around $21tr. At the time, that felt inevitable — China at $5tr, compounding fast, the US still digging out of crisis.
Fast forward, and yes — China has grown enormously, roughly into that projected range. But the real story isn’t China catching up.
It’s the US pulling away.
From $14tr to $32tr, the US didn’t just hold ground — it extended it. And that’s the part markets consistently underestimate: durability at scale.
Which makes the current mood feel familiar.
Back then, there was plenty of skepticism toward US assets — structural decline narratives, shifting power balances, the usual “this time is different” refrain. Today’s tone isn’t all that different.
But history has a way of humbling consensus trades.
Because while the narrative rotates, the outcome doesn’t always follow.
And more often than not, betting against the depth, flexibility, and persistence of the US economy has been a very expensive position to hold.
Author

Stephen Innes
SPI Asset Management
With more than 25 years of experience, Stephen has a deep-seated knowledge of G10 and Asian currency markets as well as precious metal and oil markets.




