Ethereum technical analysis: ETH/USD must break down $200
- Ethereum price is trading in the green, up 2.15% the session on Tuesday.
- ETH/USD has offered little in terms of volatility over the last 11 sessions, as the price consolidates.
- A strong barrier of resistance is observed at the psychological $200 mark, preventing further upside pressure.

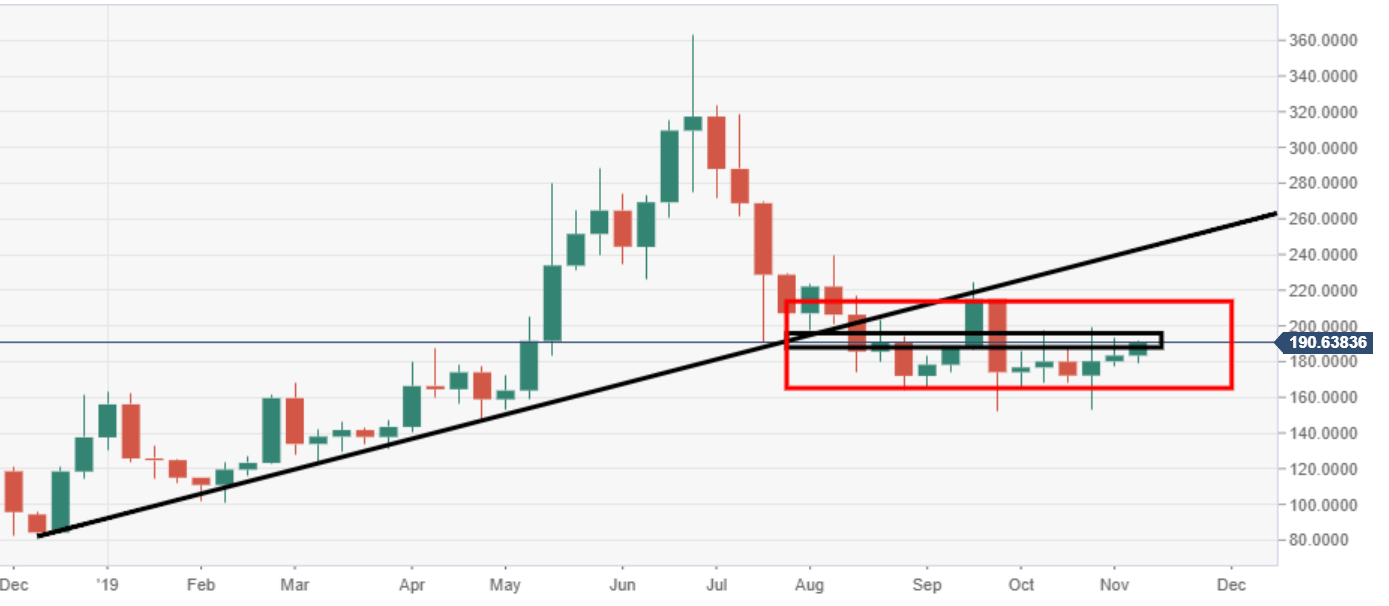
ETH/USD weekly chart
A range-block formation is observed via the weekly chart view, a lack of committed trend for now.
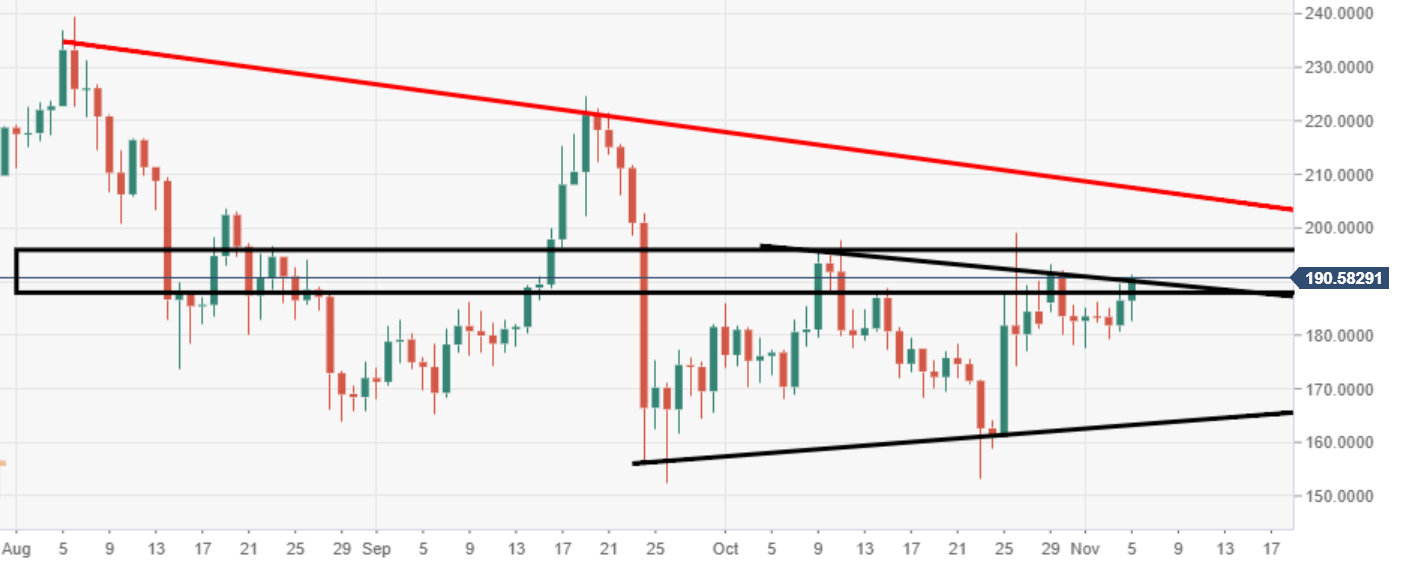
ETH/USD daily chart
Price action is narrowing within a triangular structure via the daily chart view, subject to a breakout.
Spot rate: 190.45
Relative change: +2.15%
High: 191.36
Low: 182.47
Author

Ken Chigbo
Independent Analyst
Ken has over 8 years exposure to the financial markets. He started his career as an analyst, covering a variety of asset classes; forex, fixed income, commodities and equities.
More from Ken Chigbo


