Ethereum Price Forecast: Derivatives flip bullish as ETH reclaims $2,400

Ethereum price today: $2,400
- Ethereum funding rates have flipped positive after nearly a week in negative territory.
- The move toward $2,400 has triggered a modest increase in profit and loss realization, potentially from investors breaking even.
- ETH could rise to test the $2,746 resistance if it breaks and holds above an ascending triangle.
Following an indefinite extension of the US ceasefire with Iran, Ethereum (ETH) is trading near $2,400 on Wednesday amid a recovery of bullish interest in its derivatives market.
ETH funding rates, which had been negative for nearly a week, have flipped positive, hovering around 0.0031% as of writing.
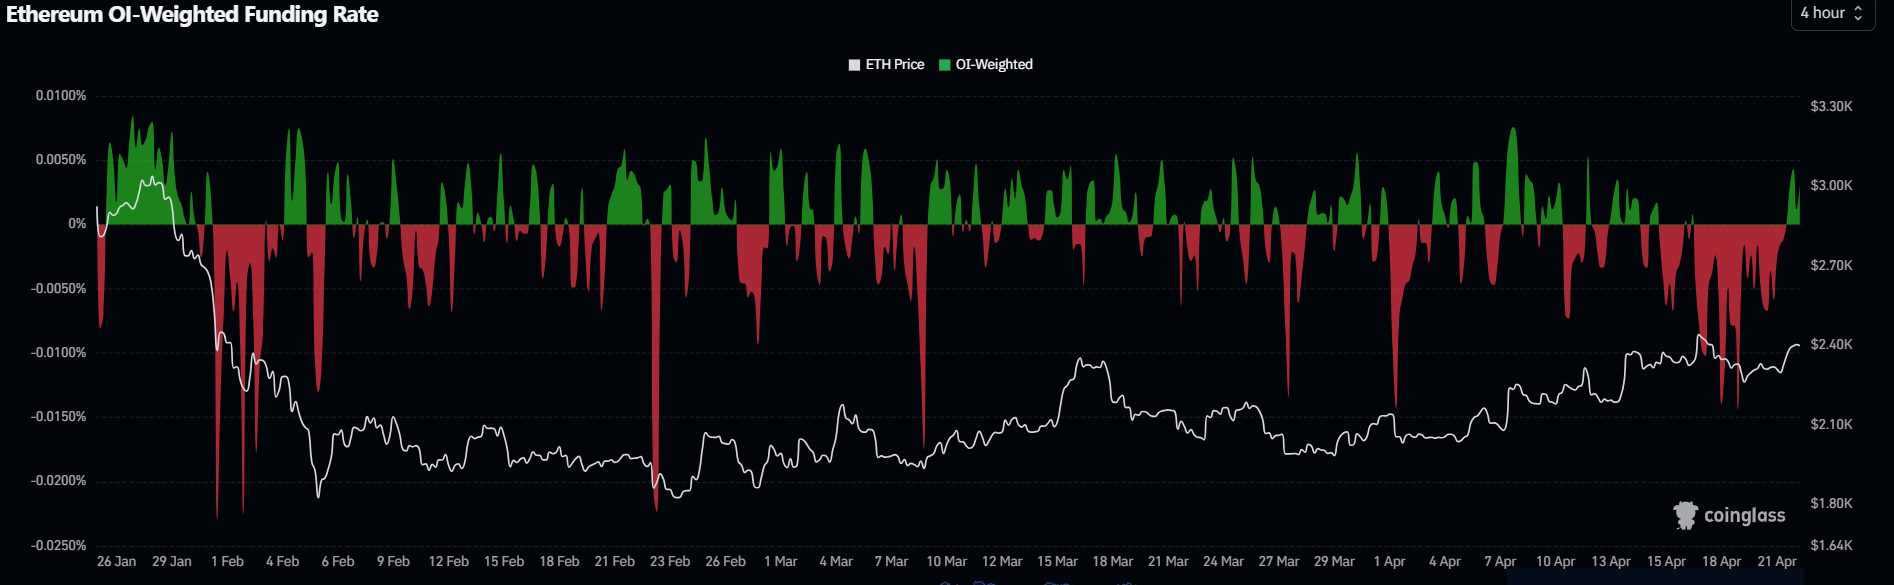
Funding rates are periodic payments between traders to align the price of a perpetual contract with its underlying spot counterpart. Long traders pay shorts when rates are positive, indicating dominant bullish positioning and vice versa when rates are negative.
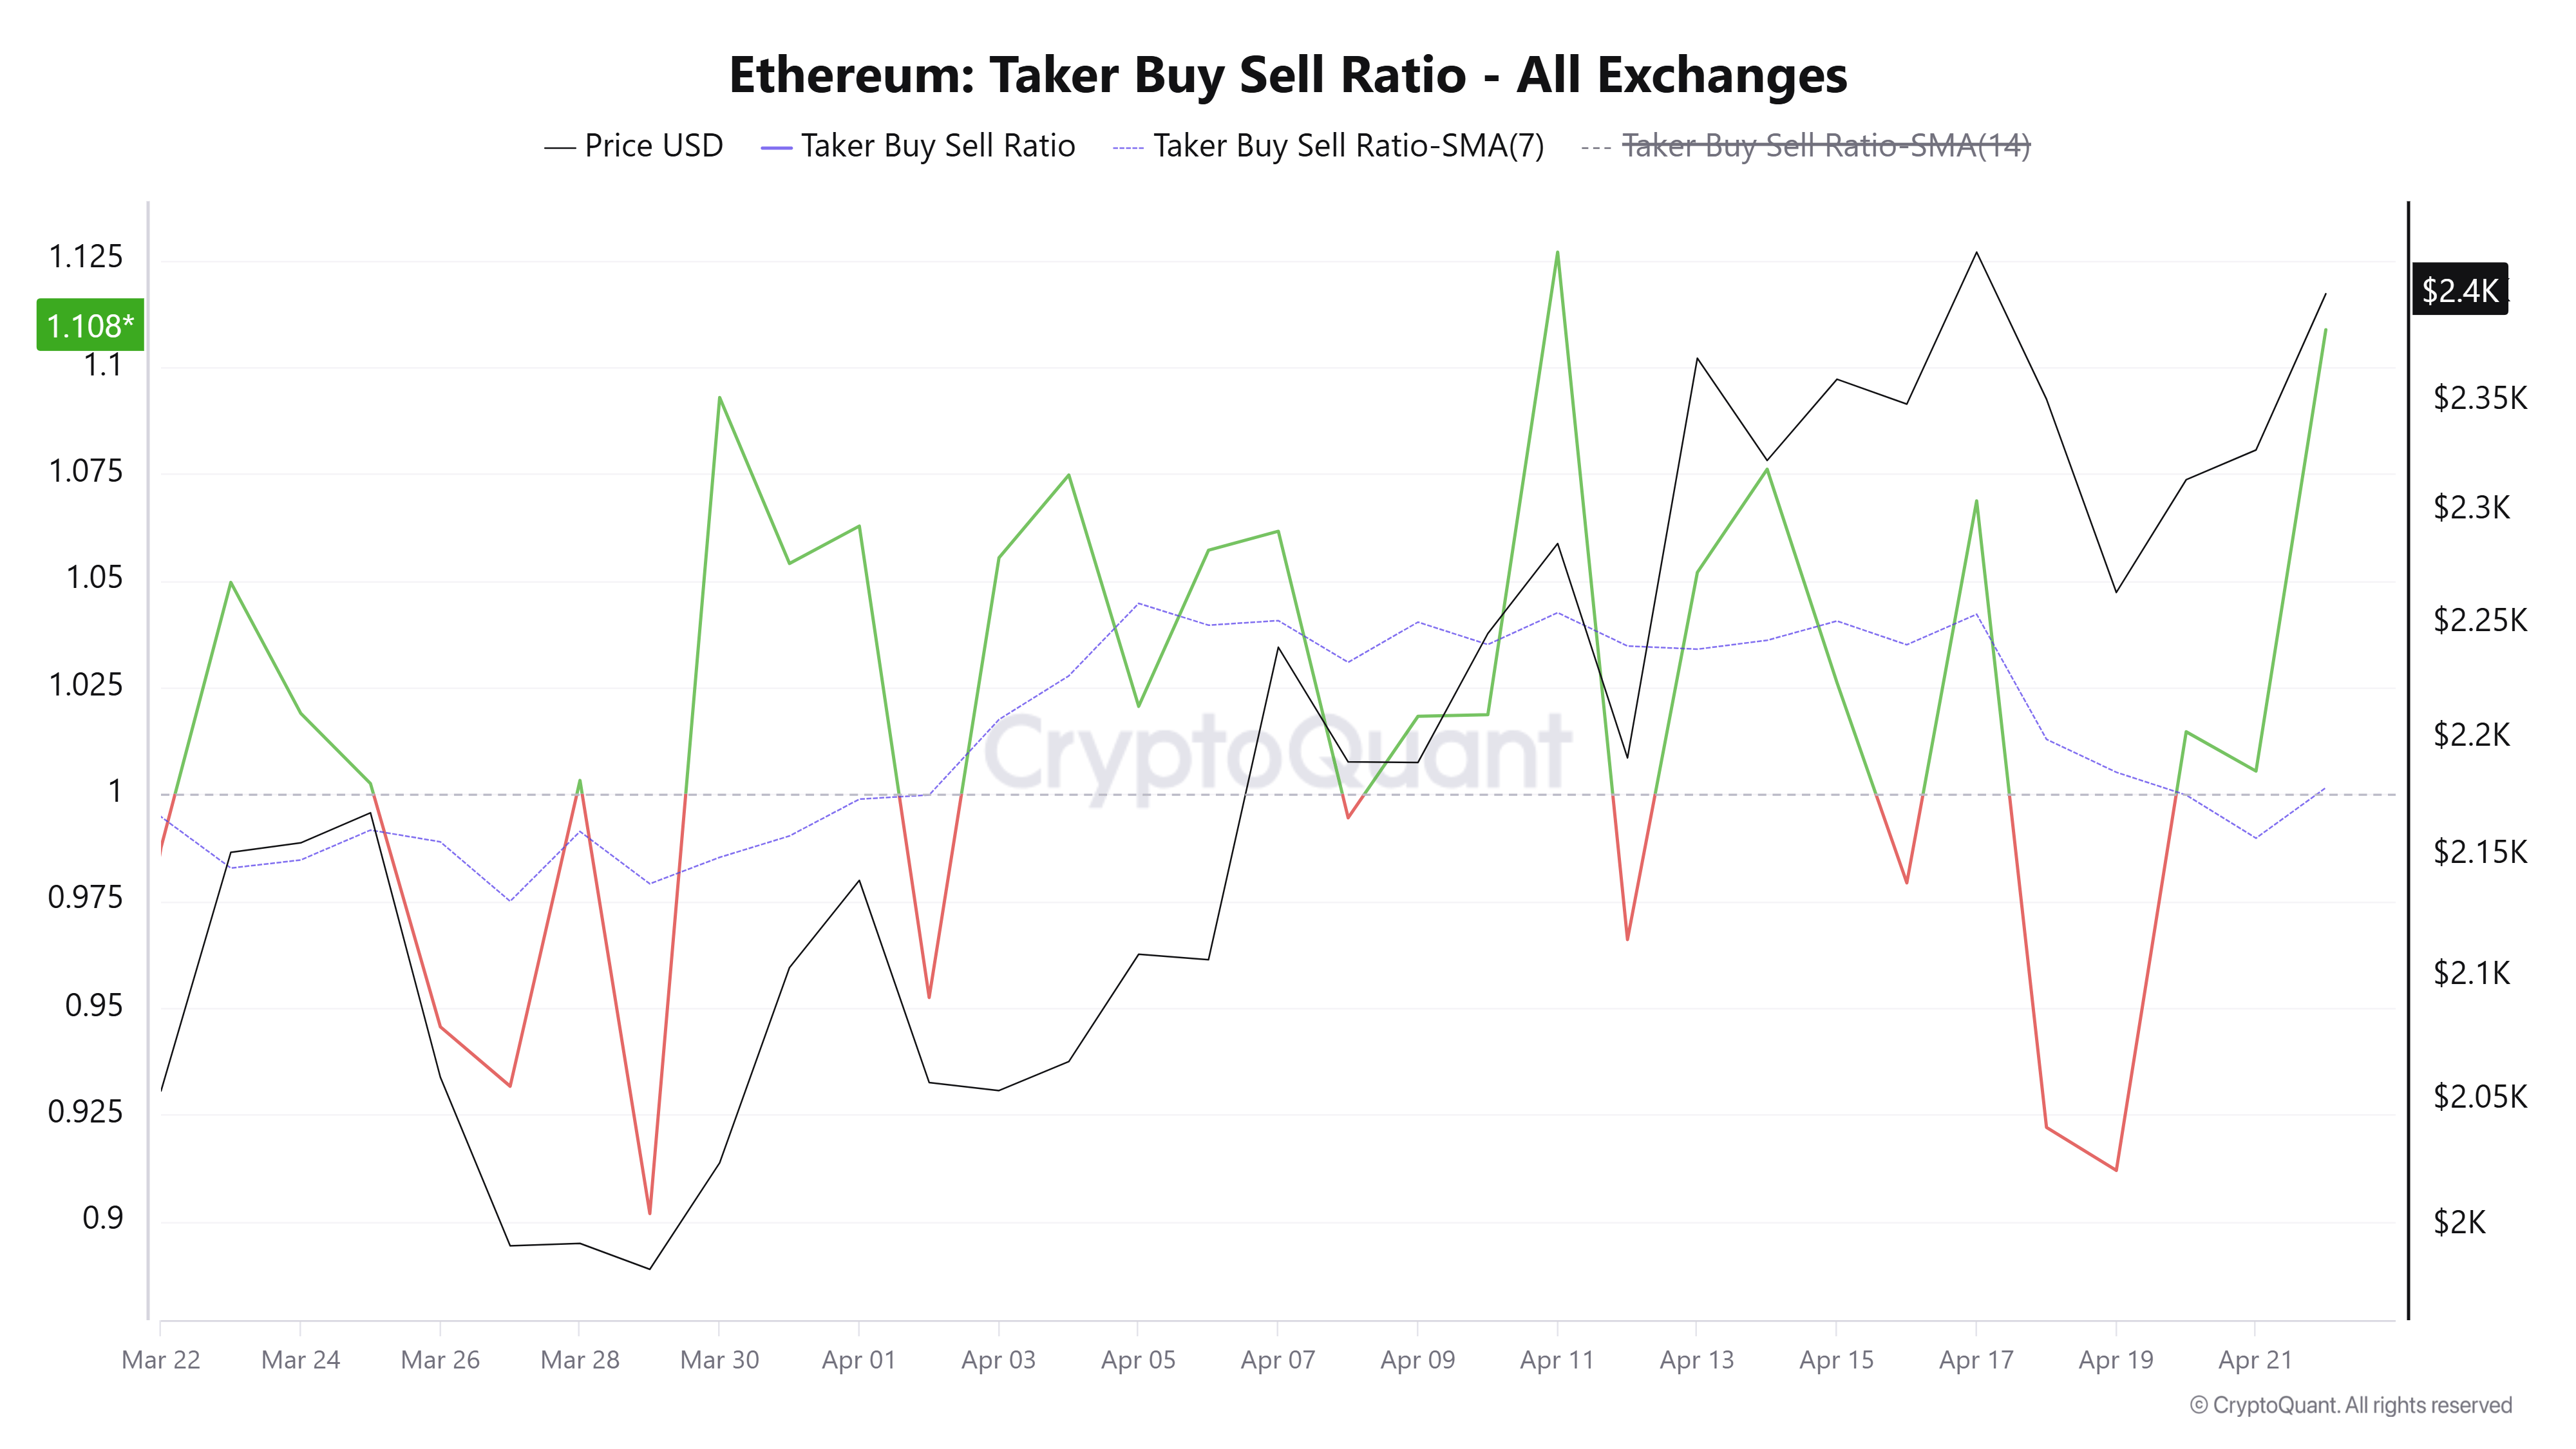
A similar sentiment is evident in the Taker Buy Sell Ratio, which measures the difference between buying and selling volumes of traders using market orders in perpetual swap trades. The metric has surged back into bullish territory, indicating that buying volume is surpassing selling volume.
The positive move triggered nearly $100 million in short liquidations over the past 24 hours, according to Coinglass data.
The bullish dominance coincides with ETH's open interest, the worth of outstanding contracts in ETH derivatives, rising by 440K ETH over the past few hours, according to Coinglass data.
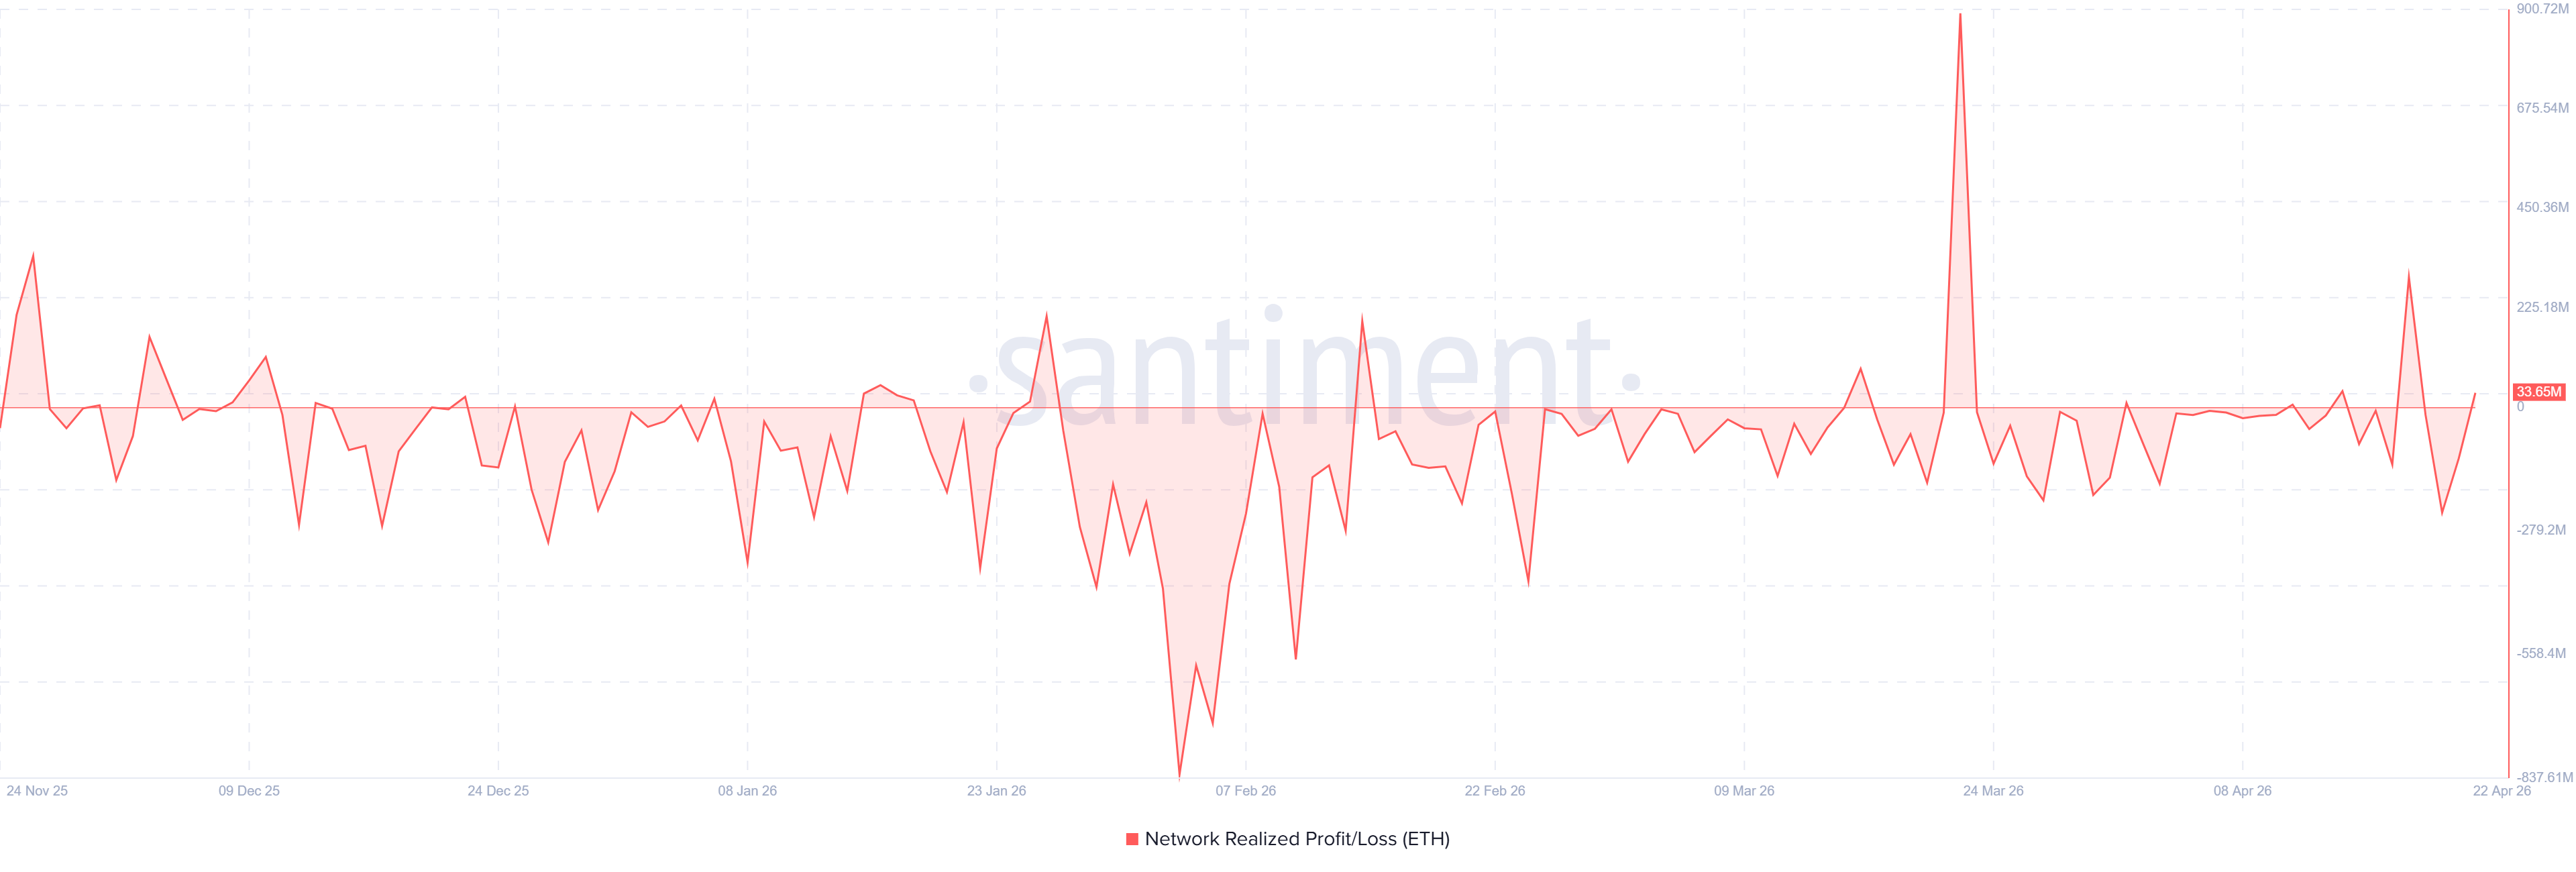
On the spot side, while demand remains, the rise toward $2,400 has triggered a slight increase in profit and loss realization over the past week. The move potentially stems from investors distributing after breaking even, given that ETH is hovering near its realized price or average onchain cost basis.
Ethereum Price Forecast: ETH eyes ascending triangle breakout to $2,746
On the daily chart, ETH is extending a constructive bias as price holds above the 20-, 50- and 100-day Exponential Moving Averages (EMAs), which are clustered between roughly $2,270 and $2,350. The proximity of the EMAs to the reclaimed uptrend support region near the trend-line break price at $2,293 reinforces the idea of dip-buying interest on pullbacks.
Momentum stays supportive, with the Relative Strength Index (RSI) around 60 and the Stochastic Oscillator (Stoch) above 70, hinting at positive but increasingly stretched upside pressure.
On the upside, ETH could validate an ascending triangle pattern if it breaks and holds above the $2,466 resistance. Such a move could see the top altcoin rise to test the $2,746 resistance before hitting $2,831. The target is obtained by measuring the triangle's height and projecting it upward from a breakout level.
On the downside, immediate support is seen at $2,388, ahead of the 100-day EMA at $2,352 and the prior trend-line break zone near the 20-day EMA. Deeper losses would expose horizontal levels at $2,211 and $2,107 before more distant floors near $1,909 and $1,741.
(The technical analysis of this story was written with the help of an AI tool.)
Author

Michael Ebiekutan
FXStreet
With a deep passion for web3 technology, he's collaborated with industry-leading brands like Mara, ITAK, and FXStreet in delivering groundbreaking reports on web3's transformative potential across diverse sectors. In addition to



