Crypto Today: Bitcoin, Ethereum, XRP hold key support amid Iran war, diminishing ETF demand
- Bitcoin holds above $70,000 as crypto prices broadly consolidate amid the US-Iran war.
- Ethereum stays above support at $2,100 despite ETF-related risk-off sentiment.
- XRP trades sideways around $1.42 as institutional and retail interest mildly returns.

Cryptocurrency prices are broadly rising on Wednesday, shrugging off the war in the Middle East, which is now in its fourth week. Bitcoin (BTC) edges up above $71,000, with immediate support at $70,000.
Altcoins, including Ethereum (ETH) and Ripple (XRP), are holding above key support levels despite diminishing interest across digital investment products.
The United States (US)-Israel war with Iran continues to be a concern for investors amid fears of lasting negative impacts on markets, and by extension, the global economy. Although the US is optimistic that talks with Iran are productive, the Iranian regime has maintained that no discussions are underway. Israel has ramped up its attacks on Iran, with the latter increasing strikes on Gulf countries.
On the bright side, WTI Crude Oil prices are edging lower, trading at $86 at the time of writing after reaching highs around $100 on Monday. Nonetheless, risk-off sentiment has persisted in markets, as evidenced by continued outflows from Exchange-Traded Funds (ETFs).
-1774432132801-1774432132802.png)
Bitcoin and Ethereum ETFs see outflows as inflows favor XRP
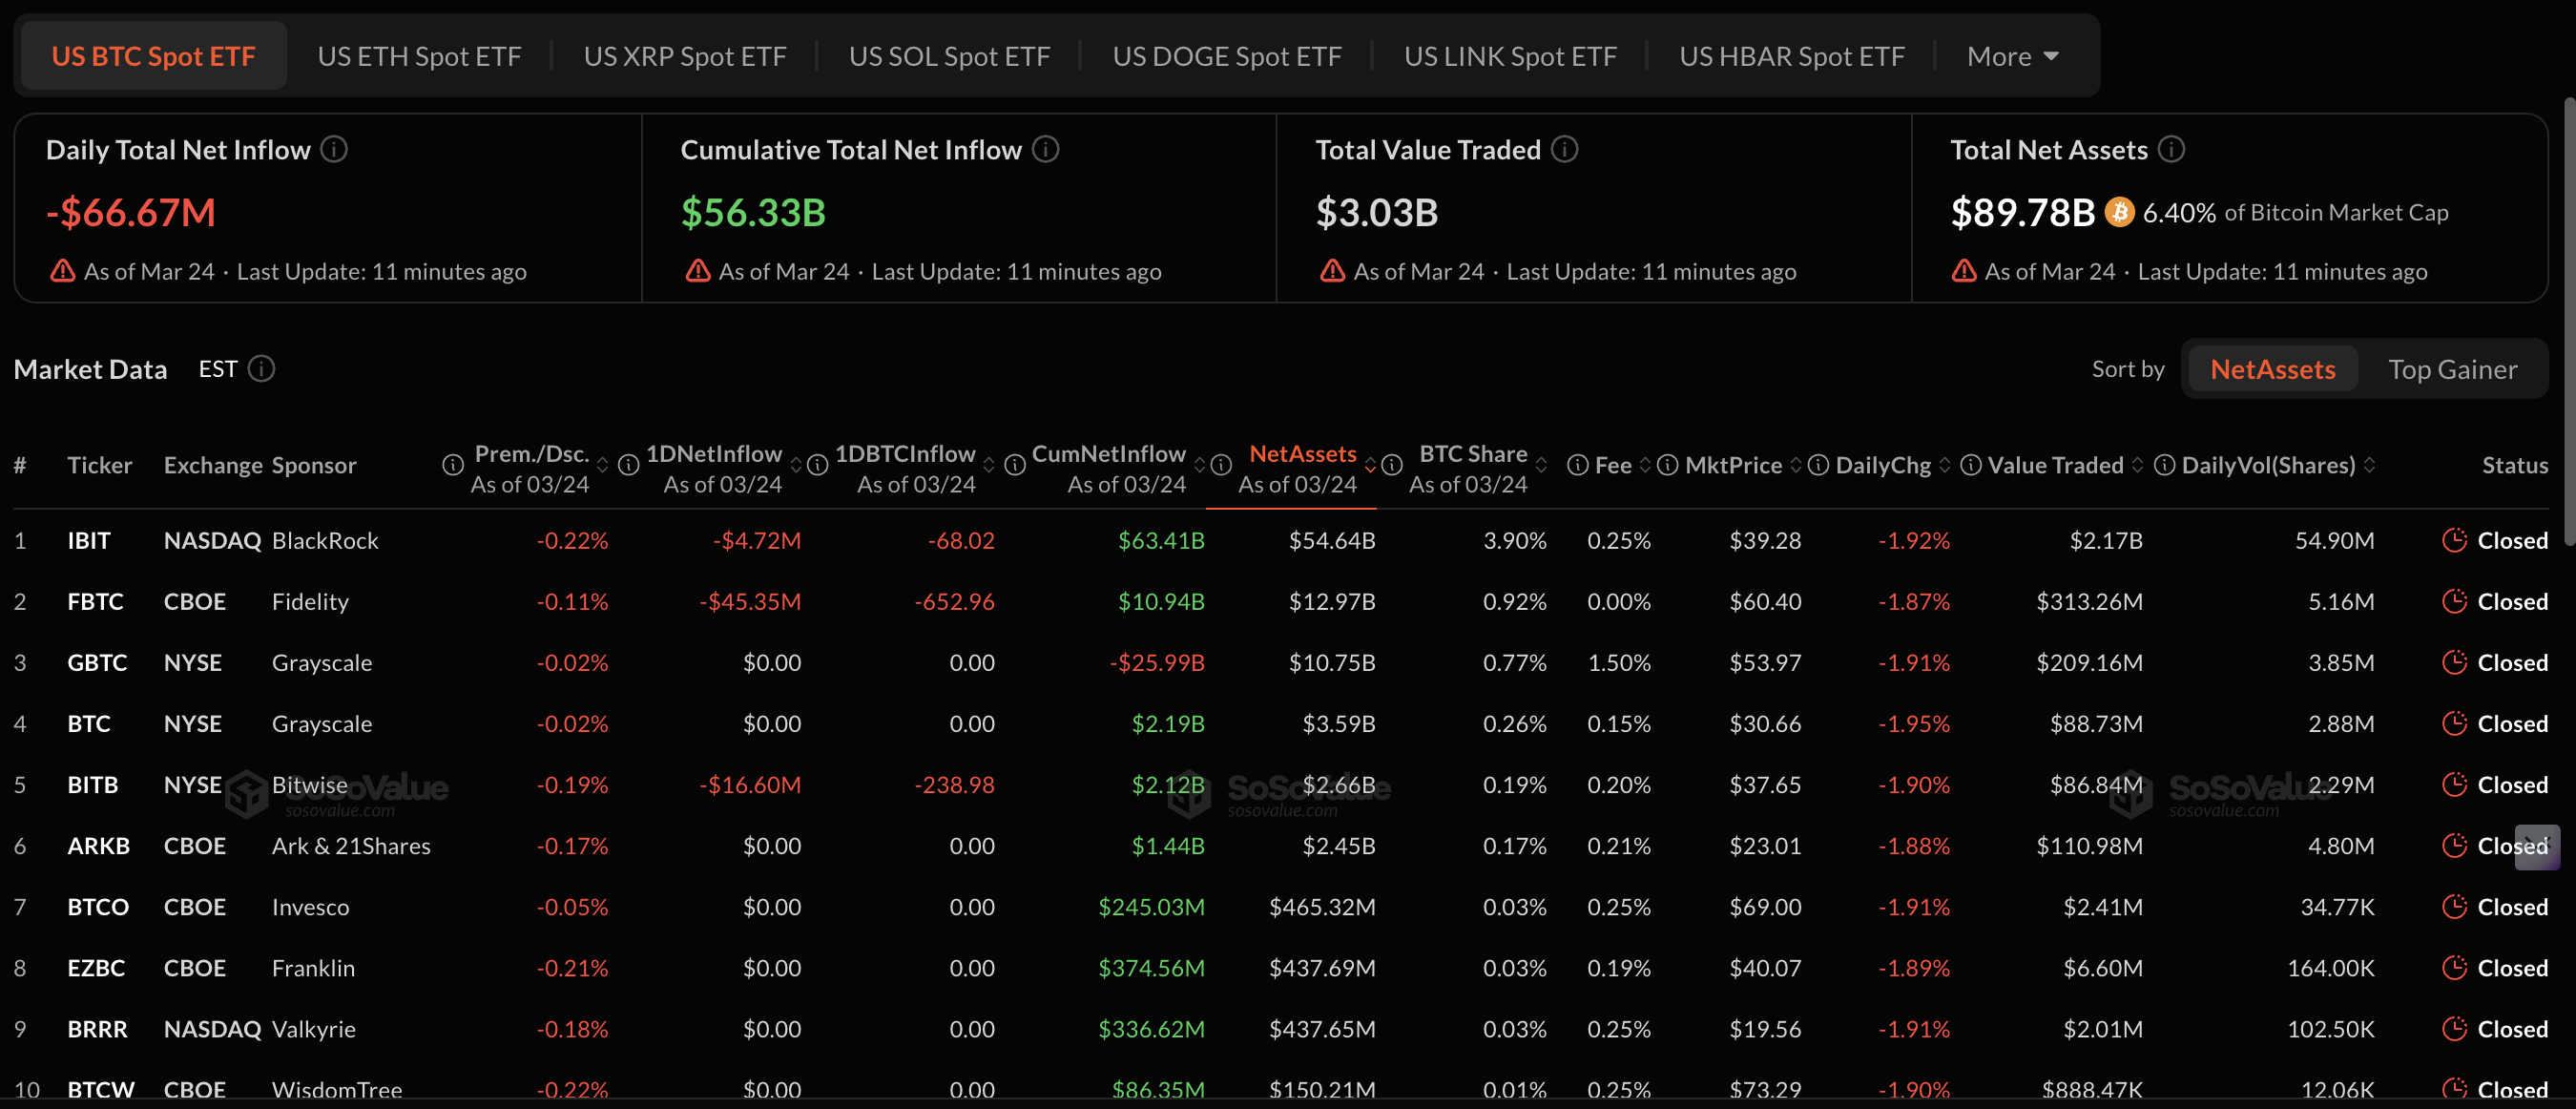
Interest in Bitcoin spot ETFs has faltered amid the Middle East war and fears of a bear market. For instance, SoSoValue data shows that following inflows of roughly $167 million on Monday, US-listed BTC ETFs recorded nearly $67 million in outflows on Tuesday.
The ETFs maintained a five-day bearish streak last week, from Wednesday through Friday, undermining investor interest. Cumulative inflows now stand at $56.33 billion with net assets under management averaging $89.78 billion.
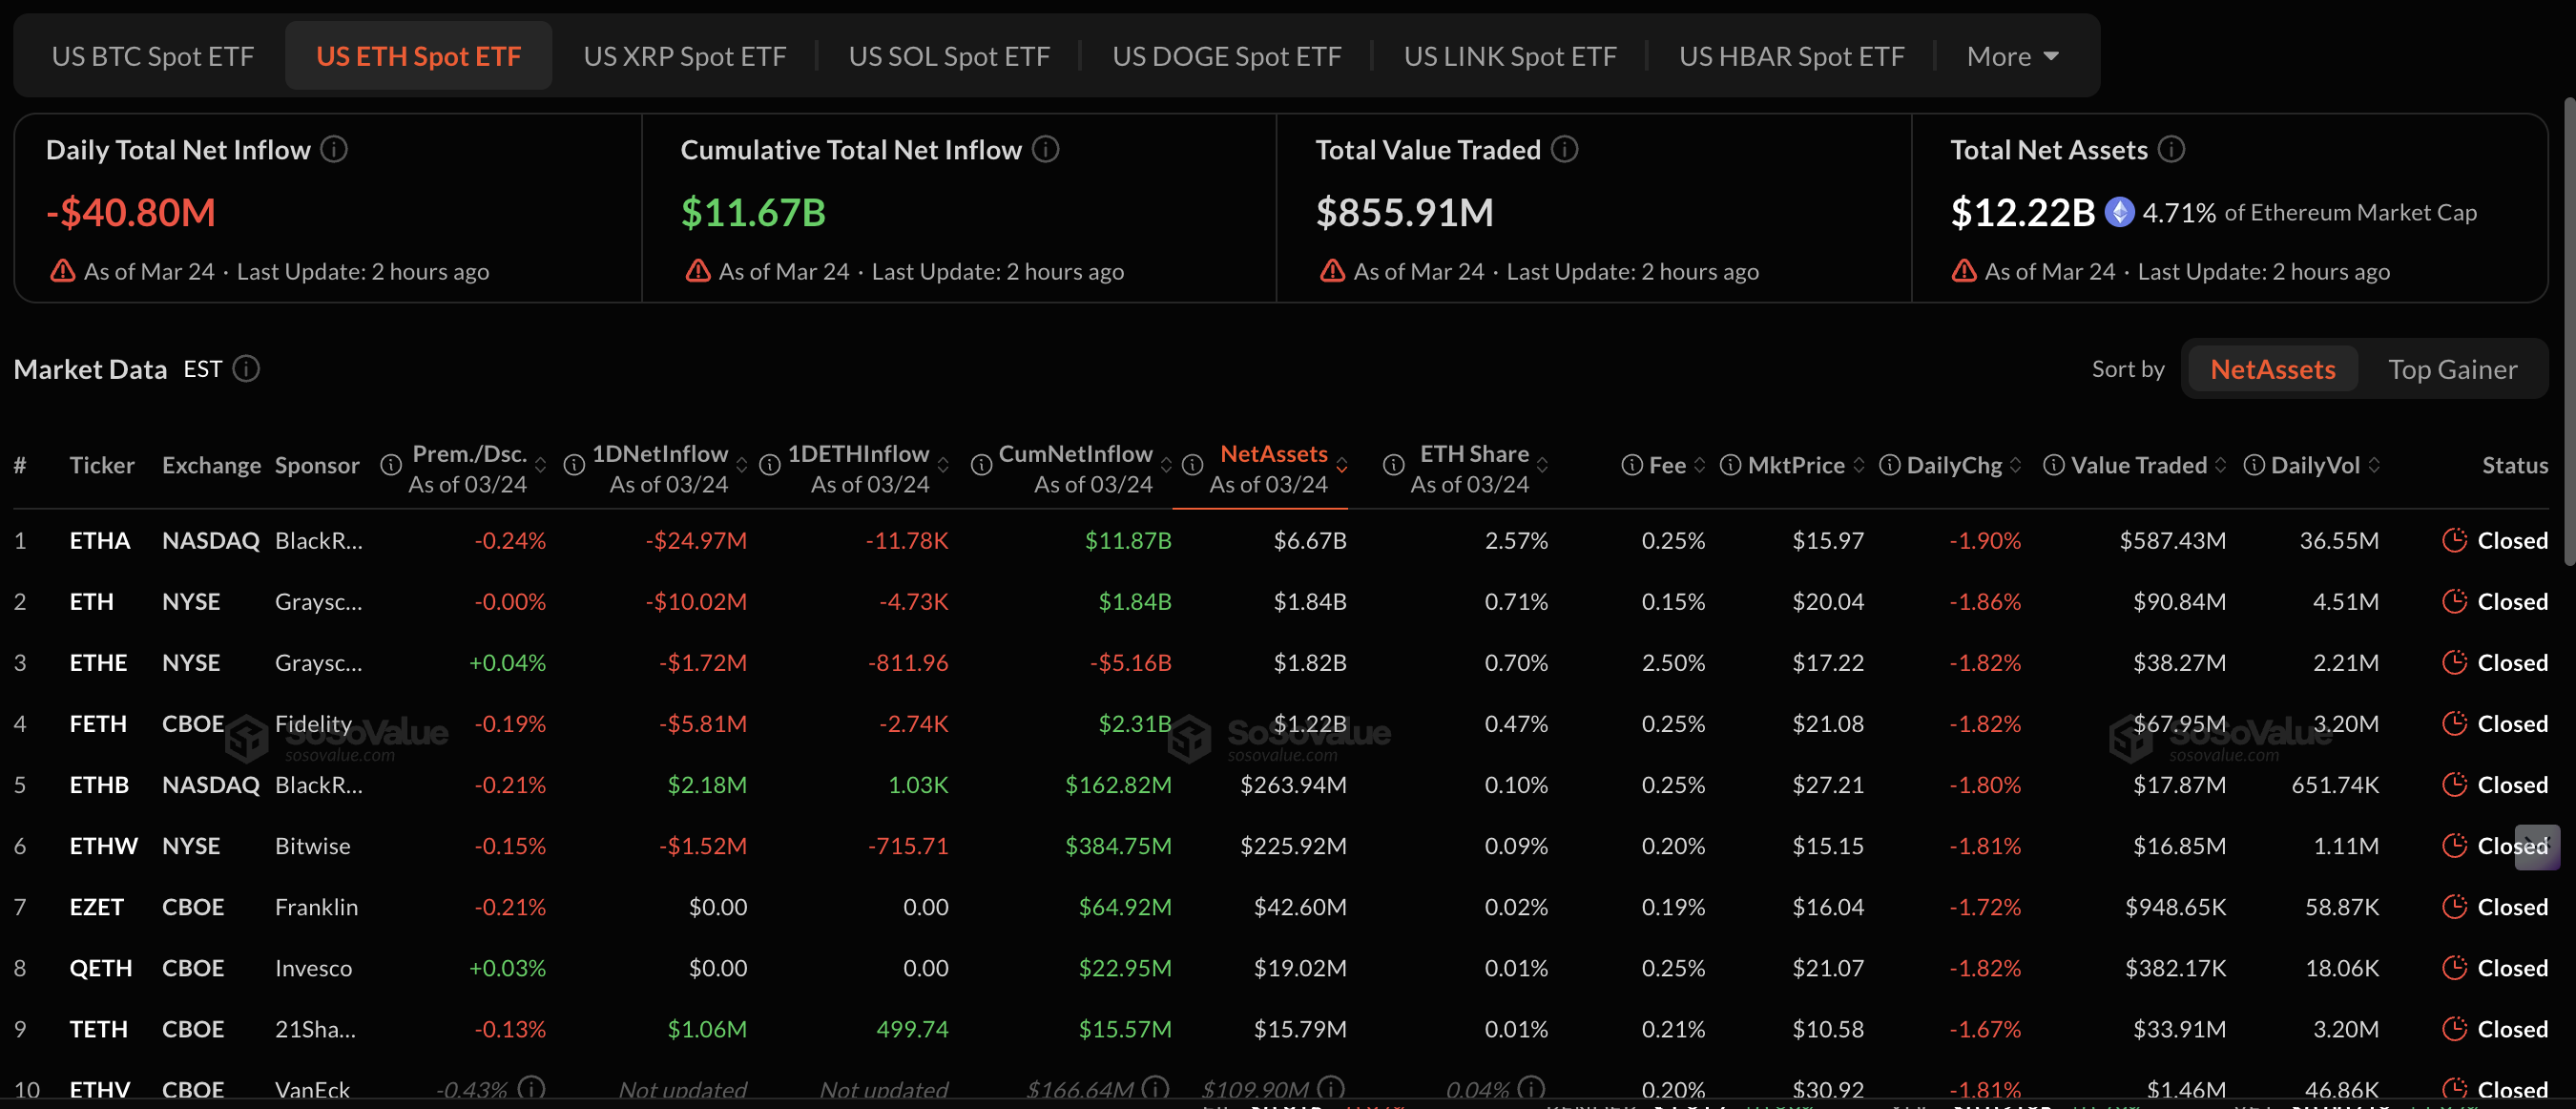
Ethereum continues to face persistent capital exit from its spot ETF products, with outflows of $41 million on Tuesday. SoSoValue data shows net assets under management averaging $12.22 billion while cumulative inflows stand at $11.67 billion.
The five-day outflow streak suggests that risk appetite for Ethereum investment products remains low, which may cap sustained recovery in the short- to medium-term.
XRP, unlike Bitcoin and Ethereum, saw mild inflows of $1.4 million into ETFs on Tuesday after muted activity on Monday. SoSoValue data shows net assets under management averaging $978 million while cumulative inflows stand at $1.21 billion.
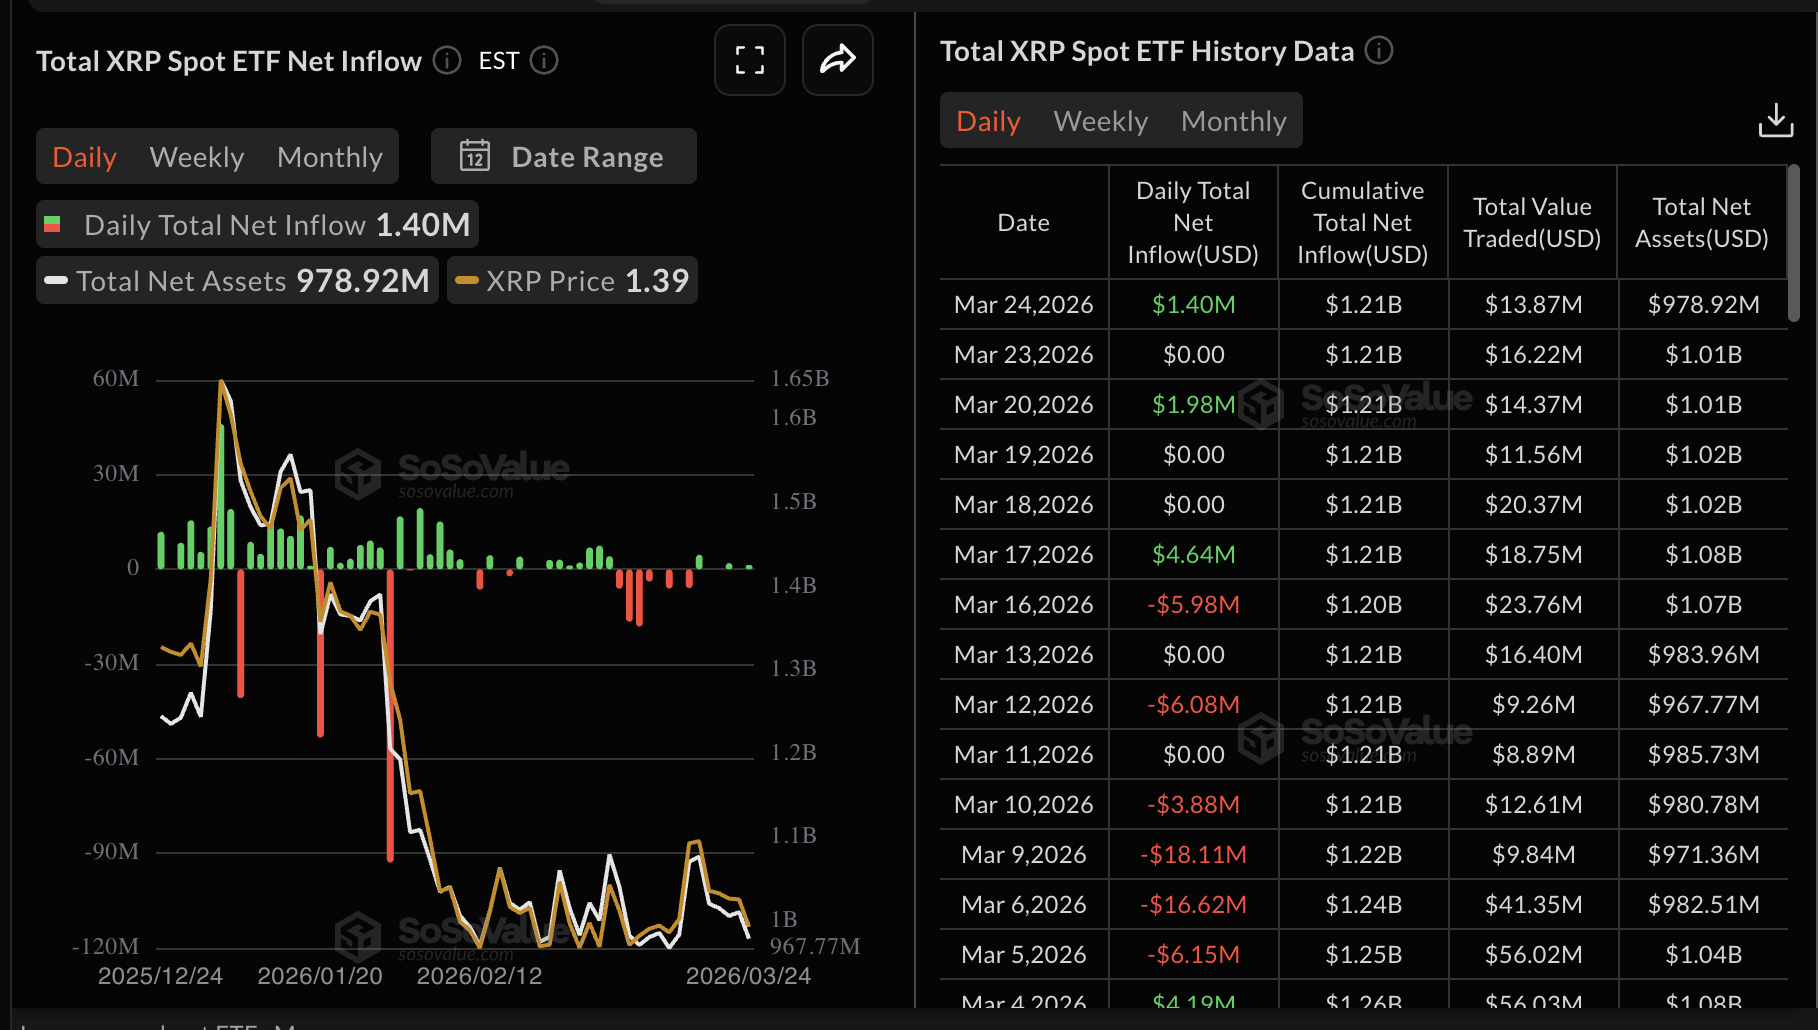
Chart of the day: Bitcoin holds steady
Bitcoin is trading above $71,000 with bulls holding $70,000 as immediate support. The near-term bias is neutral to bullish as price holds well below the 50-day, 100-day and 200-day Exponential Moving Averages.
Momentum readings remain supportive rather than stretched, with the Relative Strength Index (RSI) hovering just above 50 on the daily chart and the Moving Average Convergence Divergence (MACD) histogram bars stabilizing in positive territory.
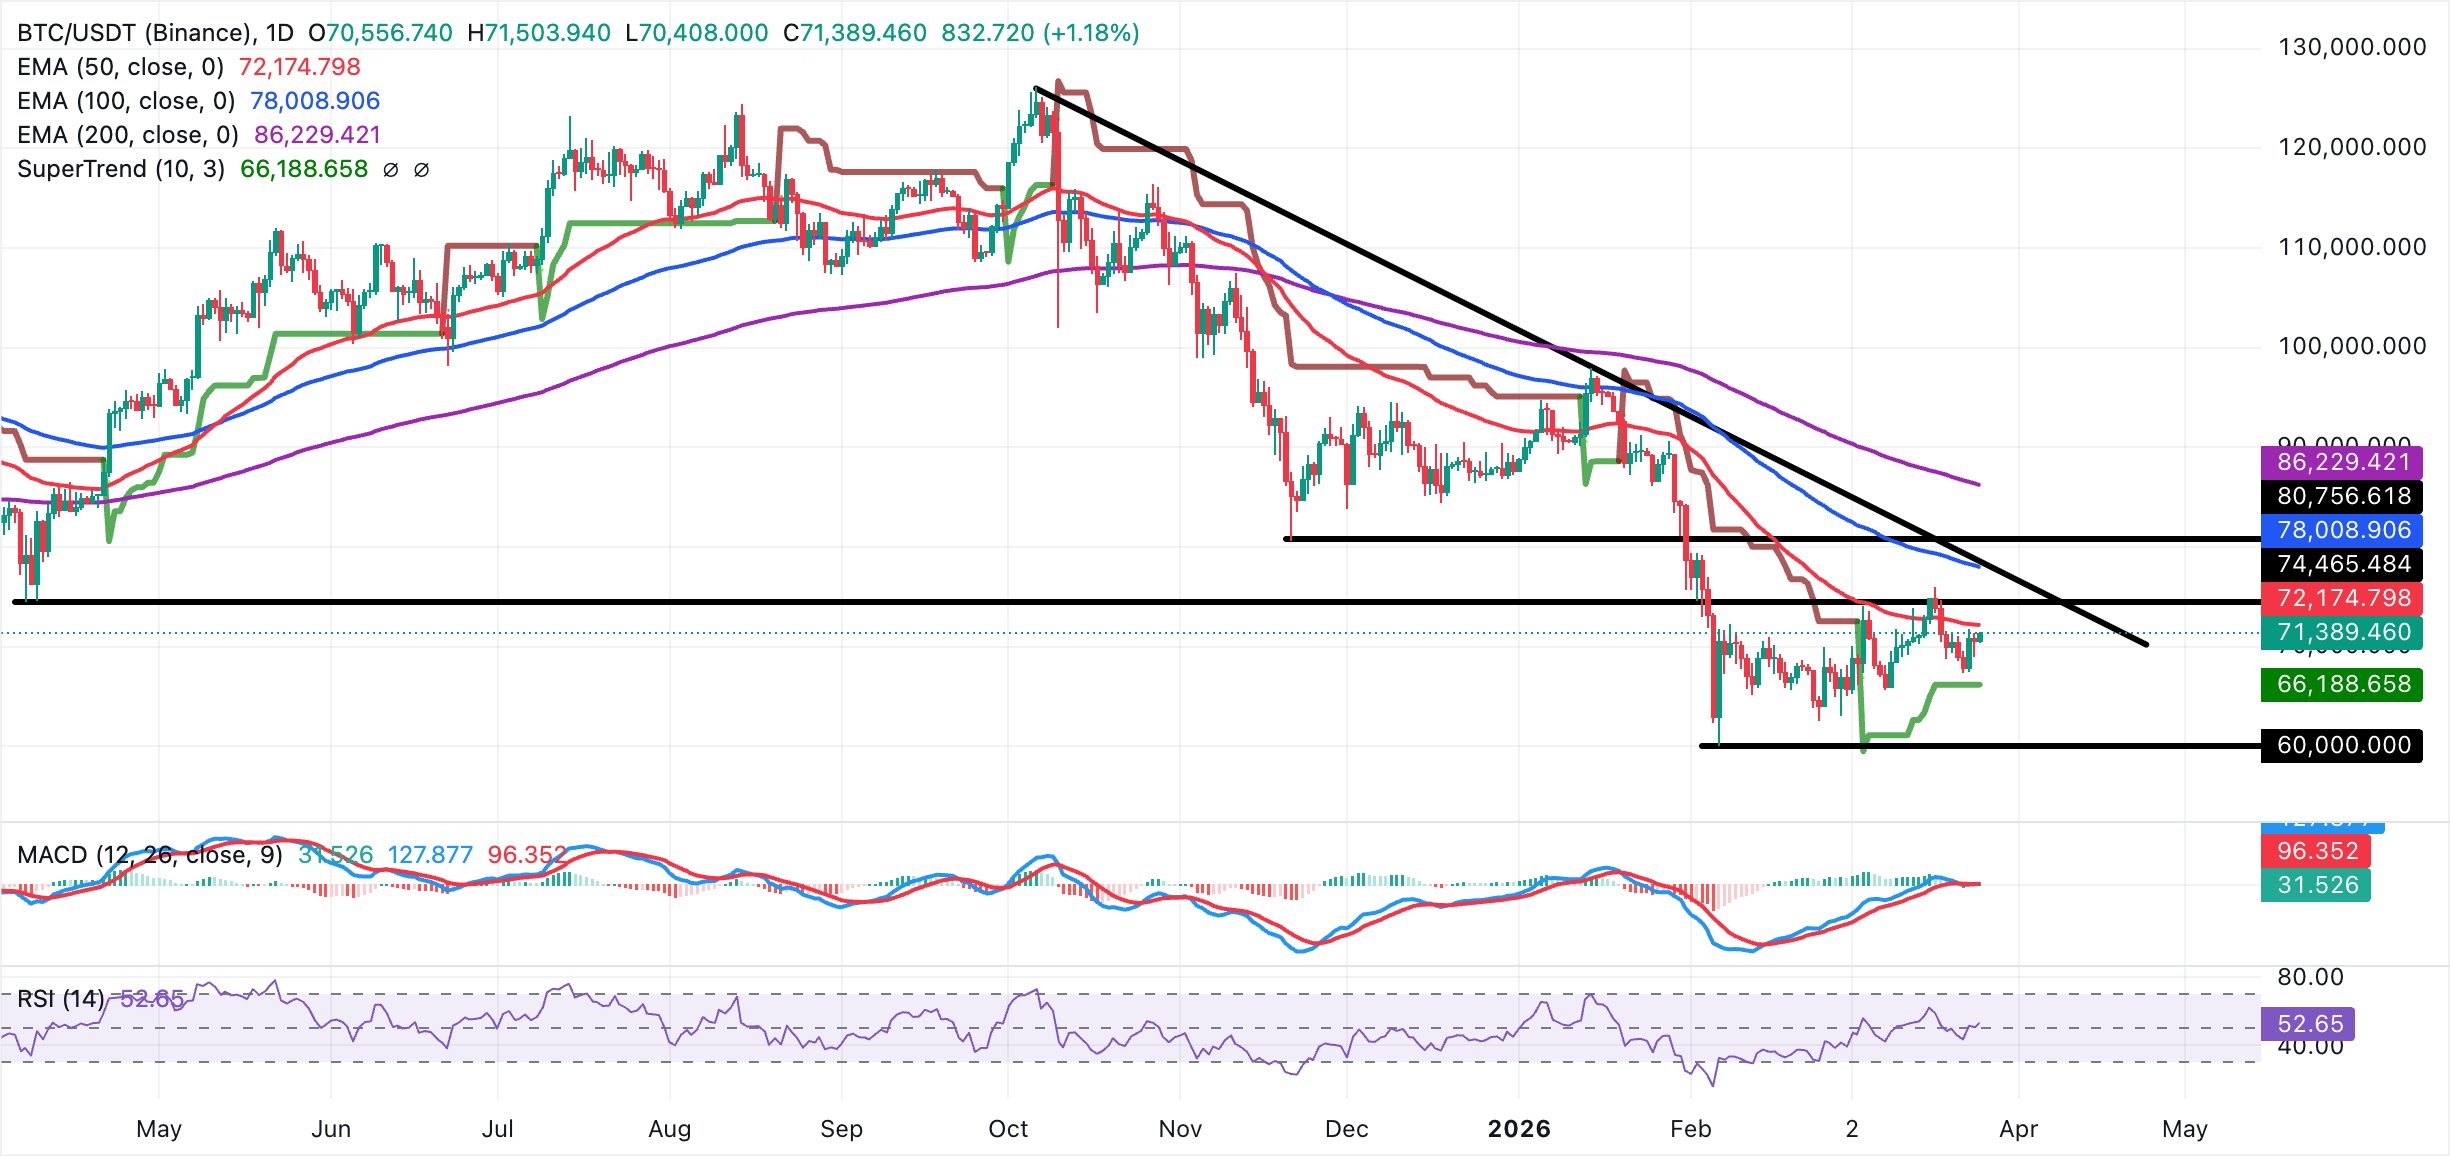
Immediate resistance emerges around $72,175, aligning with the 50-day EMA, where sellers capped advances. It is worth noting that a rejection would reinforce the current consolidation band. At the same time, a sustained move above $72,175 would expose the March high of $76,000 and bring BTC near the 100-day EMA at $78,009.
On the downside, initial support appears near $70,000, close to recent swing lows and below the SuperTrend line at $66,186. This marks a more significant support line on the daily timeframe. A decisive break below $66,186 would put the yearly low at $60,000 within reach.
Altcoins technical outlook: Ethereum and XRP signal rebound
Ethereum trades around $2,180 at the time of writing on Wednesday. The near-term bias is mildly bullish as price holds above the SuperTrend line around $1,981, keeping ETH in a recovery phase after rebounding from the mid-$1,800s. Still, daily closes remain below the long-term EMAs, which are clustered above $2,197. This outlook aligns with a broader trend that remains under corrective pressure, but short-term momentum is improving.
The MACD indicator stands just above the signal line in positive territory on the daily chart, with a modestly positive histogram that suggests building upside pressure. At the same time, the RSI is around 54 and has moved above its midline, reinforcing a gradual shift toward buyer control rather than an overextended rally.
-1774433281185-1774433281187.png)
Initial support lies at $2,100 with reinforcement around the $2,000 threshold. A break below that demand zone would expose the SuperTrend area near $1,980, with a correction likely extending to $1,850 as the next downside level.
On the upside, immediate resistance is seen at $2,197, where the 50-day EMA lies, followed by the March high at $2,386. A sustained close above $2,386 would open the way toward the descending resistance trend line projection near $2,470, where the longer-term bearish structure and the falling exponential moving averages converge to cap further gains.
As for XRP, the price holds at $1.42 amid a neutral bias, reinforced by the descending moving averages, which are currently clustered above $1.49. The MACD indicator remains marginally above its signal line but close to the zero line on the daily chart, while the histogram has been contracting, suggesting fading bullish momentum after the late spike towards $1.54. Similarly, the RSI around 49 indicates a balance of forces, suggesting consolidation after the recent pullback from this month’s highs.
-1774433971637-1774433971638.png)
Initial resistance lies at the 50-day EMA around $1.49, followed by the recent peak near $1.54, where the latest advance stalled. Above this zone, XRP will face supply at the 100-day EMA around $1.66, followed by the 200-day EMA at $1.91. On the downside, immediate support lies around $1.38-$1.40, defined by this week’s reaction lows, with a break exposing the late-range floor near $1.34 and then $1.30.
Crypto ETF FAQs
An Exchange-Traded Fund (ETF) is an investment vehicle or an index that tracks the price of an underlying asset. ETFs can not only track a single asset, but a group of assets and sectors. For example, a Bitcoin ETF tracks Bitcoin’s price. ETF is a tool used by investors to gain exposure to a certain asset.
Yes. The first Bitcoin futures ETF in the US was approved by the US Securities & Exchange Commission in October 2021. A total of seven Bitcoin futures ETFs have been approved, with more than 20 still waiting for the regulator’s permission. The SEC says that the cryptocurrency industry is new and subject to manipulation, which is why it has been delaying crypto-related futures ETFs for the last few years.
Yes. The SEC approved in January 2024 the listing and trading of several Bitcoin spot Exchange-Traded Funds, opening the door to institutional capital and mainstream investors to trade the main crypto currency. The decision was hailed by the industry as a game changer.
The main advantage of crypto ETFs is the possibility of gaining exposure to a cryptocurrency without ownership, reducing the risk and cost of holding the asset. Other pros are a lower learning curve and higher security for investors since ETFs take charge of securing the underlying asset holdings. As for the main drawbacks, the main one is that as an investor you can’t have direct ownership of the asset, or, as they say in crypto, “not your keys, not your coins.” Other disadvantages are higher costs associated with holding crypto since ETFs charge fees for active management. Finally, even though investing in ETFs reduces the risk of holding an asset, price swings in the underlying cryptocurrency are likely to be reflected in the investment vehicle too.
(The technical analysis of this story was written with the help of an AI tool.)
Author

John Isige
FXStreet
John Isige is a seasoned cryptocurrency journalist and markets analyst committed to delivering high-quality, actionable insights tailored to traders, investors, and crypto enthusiasts. He enjoys deep dives into emerging Web3 tren



