Crypto Overview: Bitcoin holds steady as ETF outflows decline – DEXE and TIA extend gains
- Bitcoin edges above $64,000 on Tuesday, following a roughly 4% decline last week.
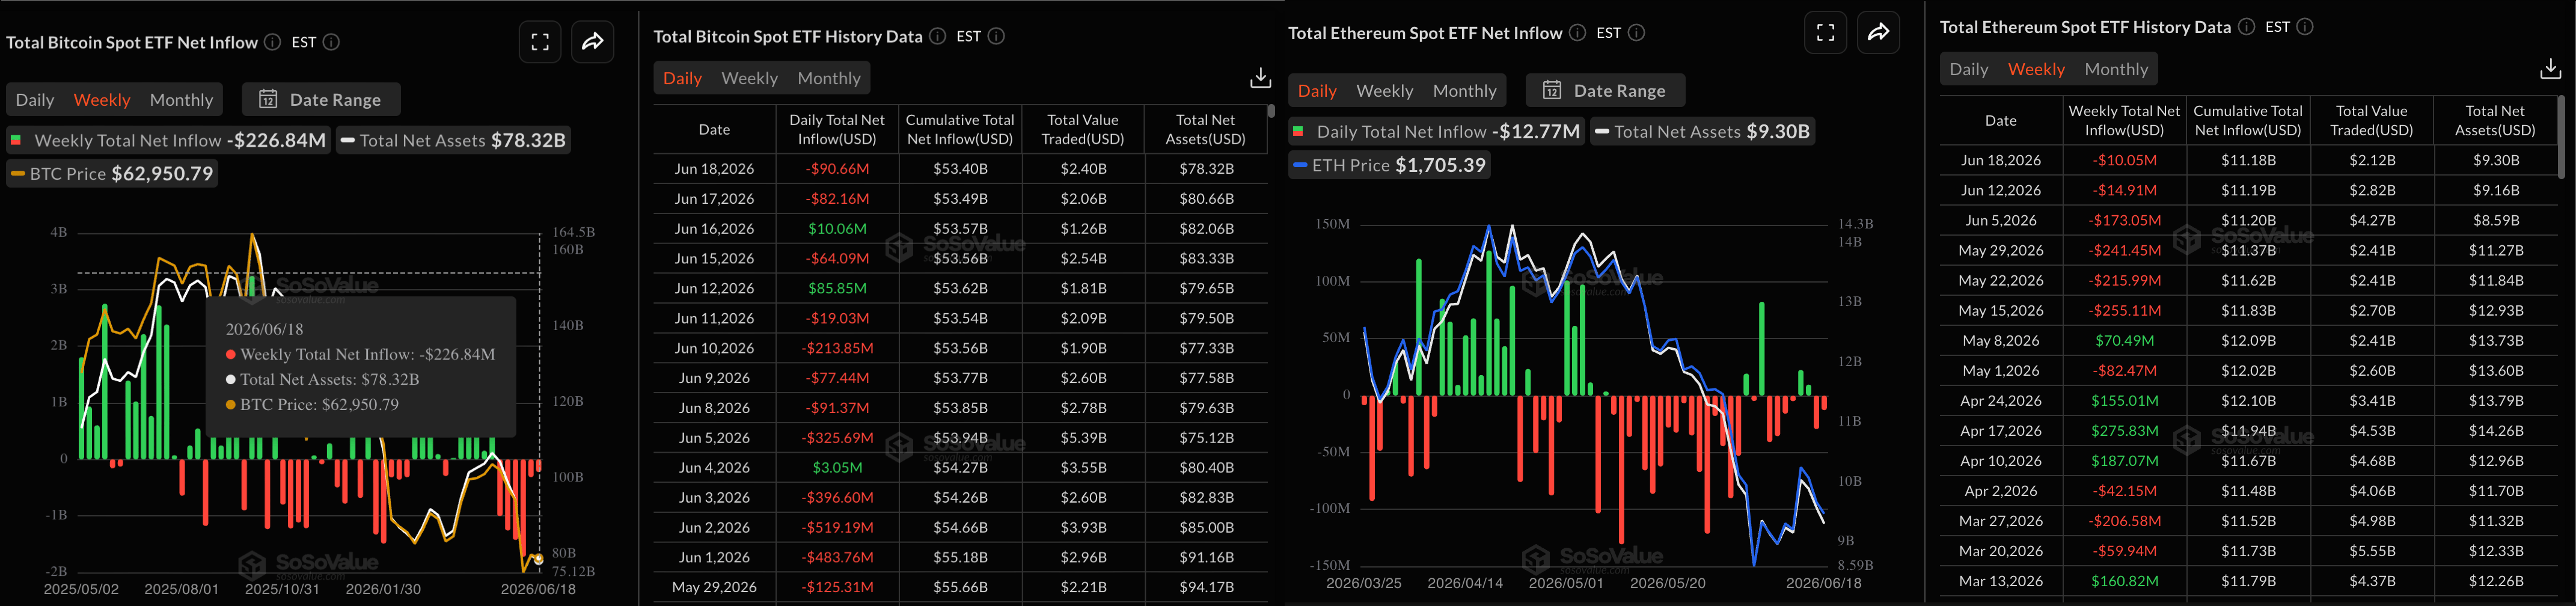
- Bitcoin and Ethereum ETFs recorded $226 million and $10 million last week, extending their outflow streak to six consecutive weeks.
- DeXe and Celestia extend gains as the broader crypto market remains heavy.

Bitcoin (BTC) hovers above $64,000 at press time on Tuesday, holding steady after a roughly 4% drop last week. Data shows that institutional outflows are easing, suggesting broader market recovery potential, while DeXe (DEXE) and Celestia (TIA) have emerged as frontrunners over the last 24 hours.
Bitcoin sustains a minor recovery as ETF outflows cool
Bitcoin-focused Exchange Traded Funds (ETFs) recorded four consecutive weeks of over $1 billion in outflows in May and early June. However, institutional trimming has since eased, with $226 million in outflows last week and $315 million the previous week.
Six consecutive weeks of outflows are mirrored in Ethereum (ETH)-focused ETFs, with $10.05 million last week, followed by $14.91 million the previous week.
Bitcoin maintains a mixed near-term bias, with price remaining below both the 50-day and 200-day Exponential Moving Averages (EMAs) at roughly $68,889 and $78,623, respectively, but holding above a short-term support trendline.
Momentum is mixed on the daily chart, with the Moving Average Convergence Divergence (MACD) holding positive histograms as the average lines rise, while the Relative Strength Index (RSI) at around 41 remains below the neutral band, suggesting rallies could still meet selling pressure.
On the topside, initial resistance is seen at the 50-day EMA near $68,889, where any rebound is likely to be tested, followed by the reclaimed bearish rising trendline around $73,439, with the 200-day EMA near $78,623 acting as a more distant cap.
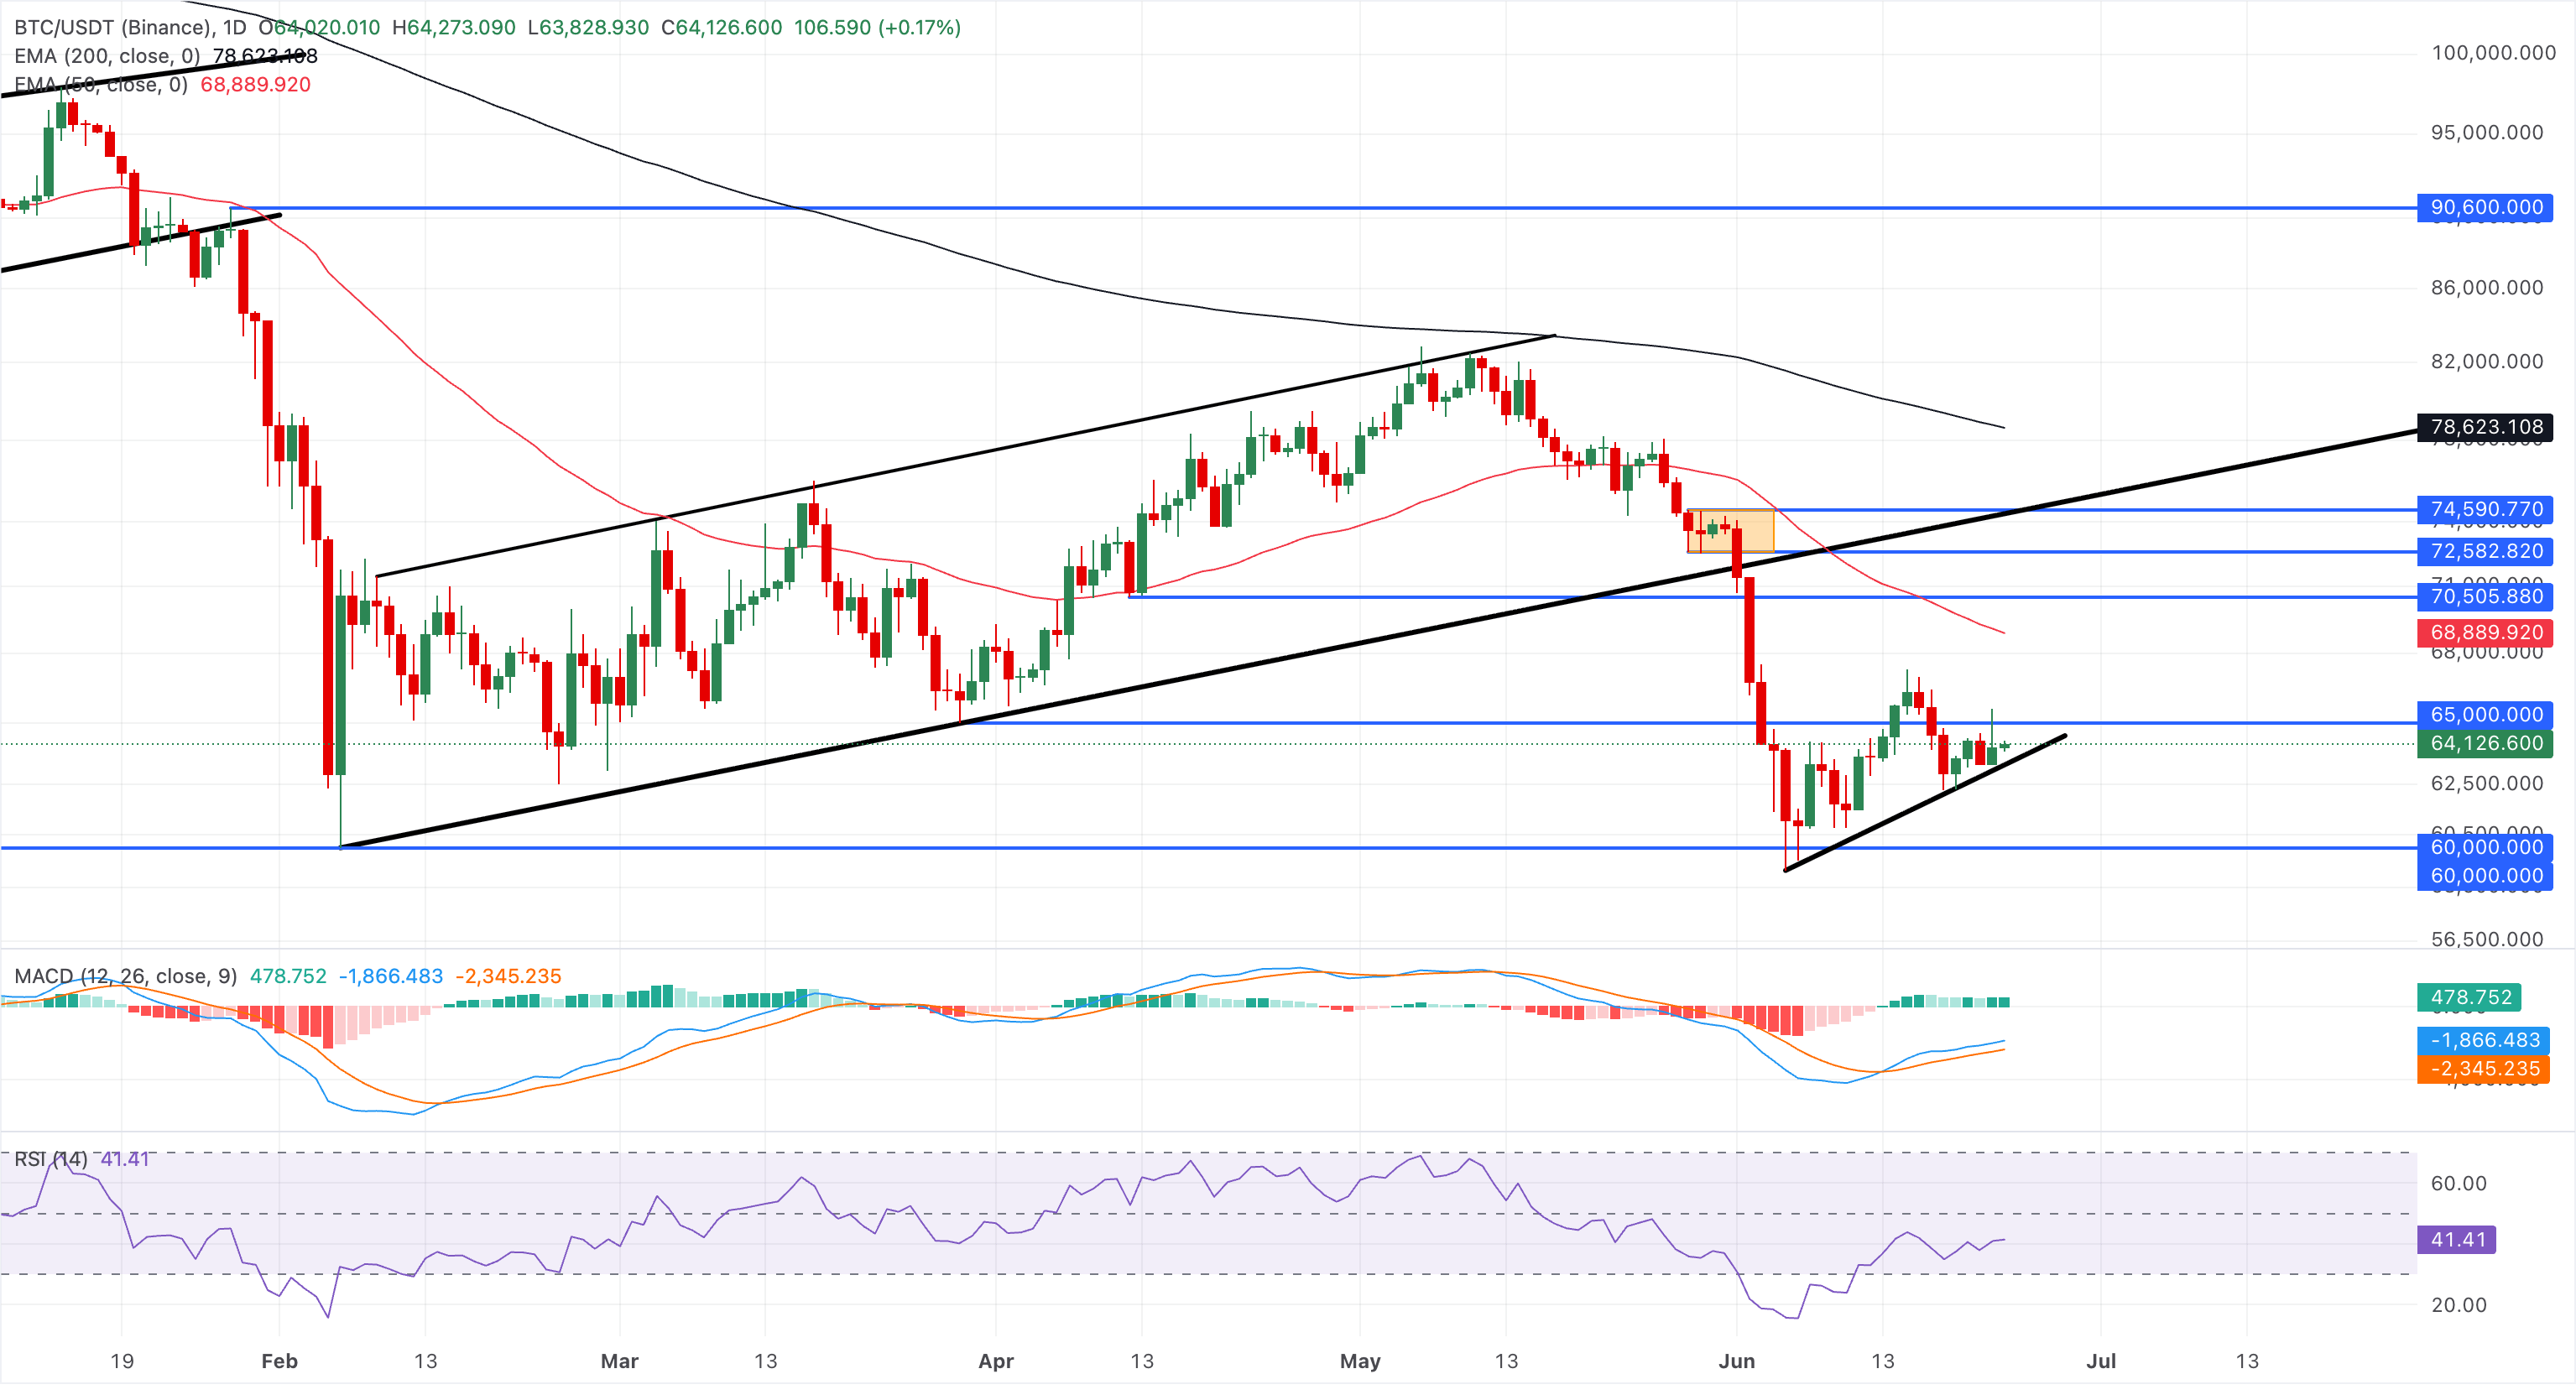
On the downside, immediate support emerges from the more recent upward trend configuration around $63,341, while a deeper pullback would put focus on the psychological and structural floor at $60,000, where buyers previously defended the larger bullish structure.
DeXe and Celestia regain bullish strength
DeXe is up over 18% on Tuesday, extending its 32% rise from the previous day. DEXE holds well above the 50-day EMA around $16.13 and the 200-day EMA near $10.67, approaching the June 3 high at $24.49.
The RSI near 60 suggests positive but not overstretched momentum even as the MACD line rises toward its signal line for a potential bullish crossover, hinting at a moderating bullish impulse rather than outright exhaustion.
Looking up, the next notable resistance aligns with the Fibonacci anchor near $24.49, where a sustained break higher would reopen the path toward fresh cycle highs. The 127.2% and 161.8% Fibonacci extension levels are at $31.40 and $43.08, respectively, serving as overhead barriers.
Looking down, initial support is seen at the 78.6% Fibonacci retracement at $20.14, followed by the 50% retracement at $15.50.
Celestia is up over 3% at press time on Tuesday, extending its 5% rebound from the 50-day EMA at $0.3738 the previous day. Momentum has improved as the RSI lifts toward 56 and the MACD and signal line rise into the positive territory, hinting that buyers retain the short-term initiative while price remains above the 50-day EMA.
On the topside, initial resistance is aligned at the 50% retracement of the downswing from $0.6257 to $0.2693, at $0.4104, ahead of a stronger supply barrier between $0.4596 and $0.4722.
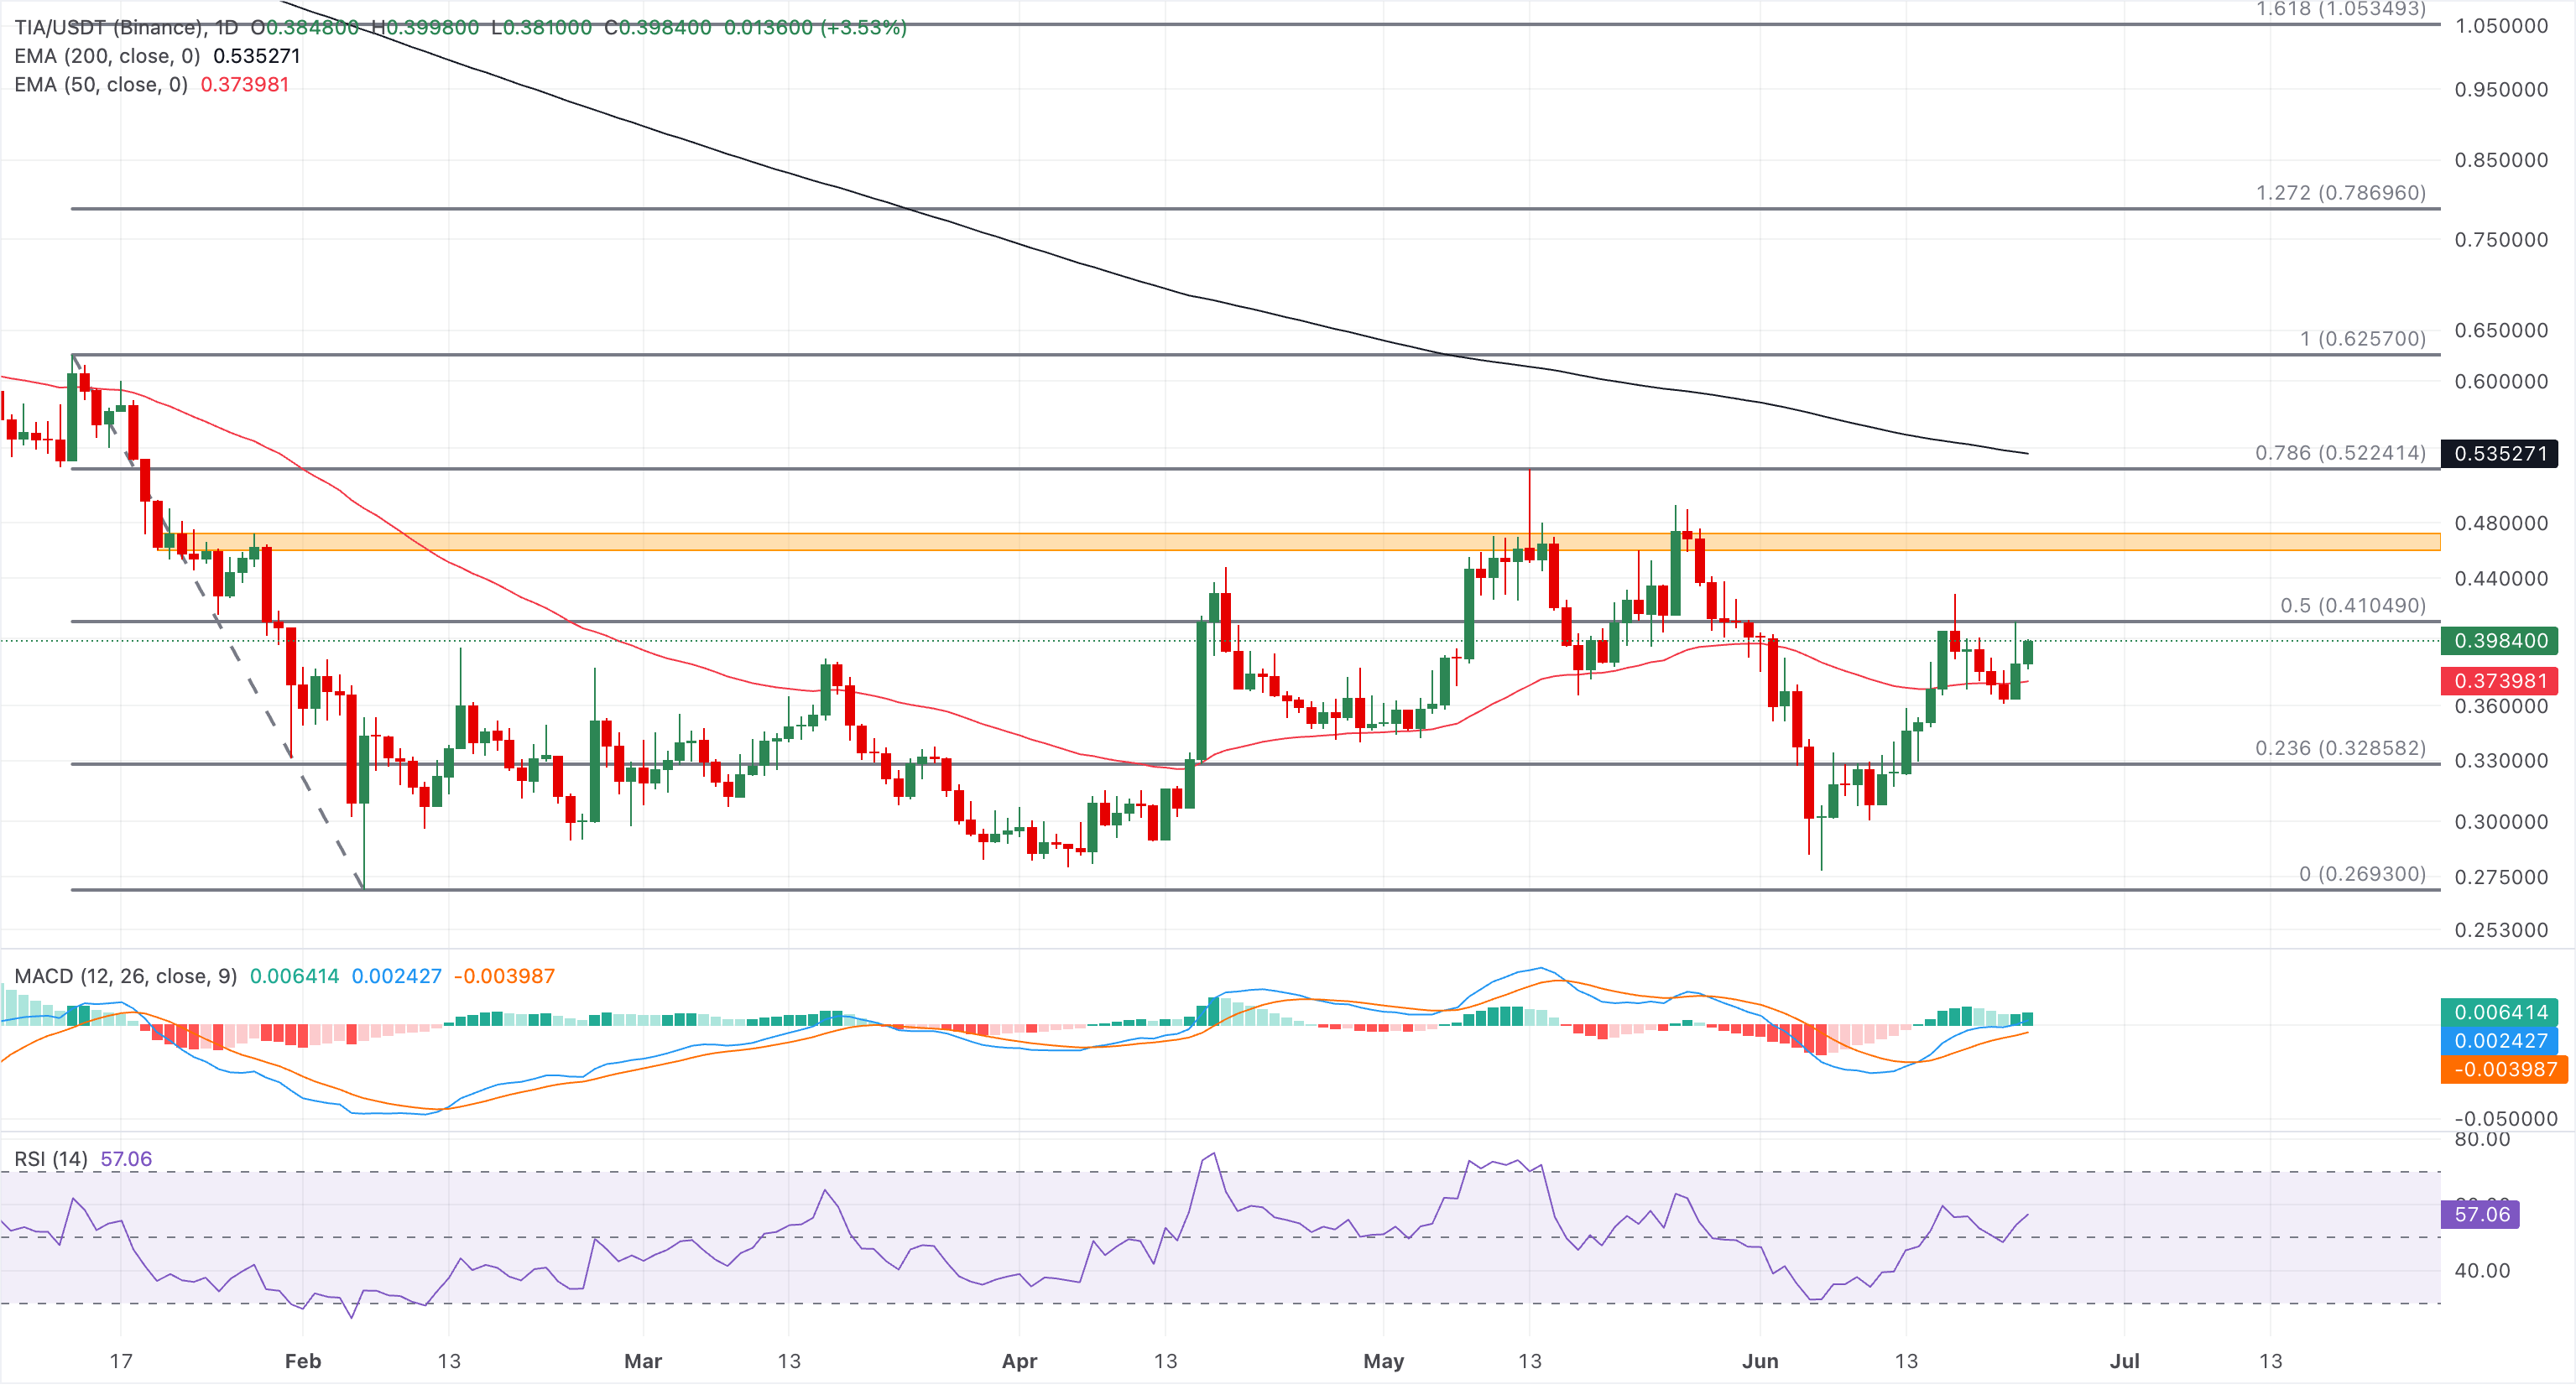
On the downside, immediate support is seen around the 50-day EMA at $0.3738. A break there would expose the 23.6% retracement at $0.3285, while only a deeper slide toward the $0.2693 swing low would undermine the emerging constructive tone.
(The technical analysis of this story was written with the help of an AI tool.)
Author

Vishal Dixit
FXStreet
Vishal Dixit holds a B.Sc. in Chemistry from Wilson College but found his true calling in the world of crypto.