Cardano Price Forecast: ADA risks decline to a five-year low amid market-wide pullback
- Cardano is down over 3% so far on Tuesday, risking a steeper correction to a five-year low below $0.2200.
- Negative funding rate and a sharp imbalance in long liquidations suggest waning retail demand.
- The technical outlook for ADA is weak, with momentum indicators signaling mounting bearish pressure.

Cardano (ADA) price is down 3% at press time on Tuesday, extending a steady decline seen over the last three weeks. Cardano’s declining trend mirrors the broader market pullback and continues to lose retail strength in the derivatives market. Technically, the ADA price is under intense selling pressure and risks forming the next leg below $0.2200.
Bears dominate ADA derivatives
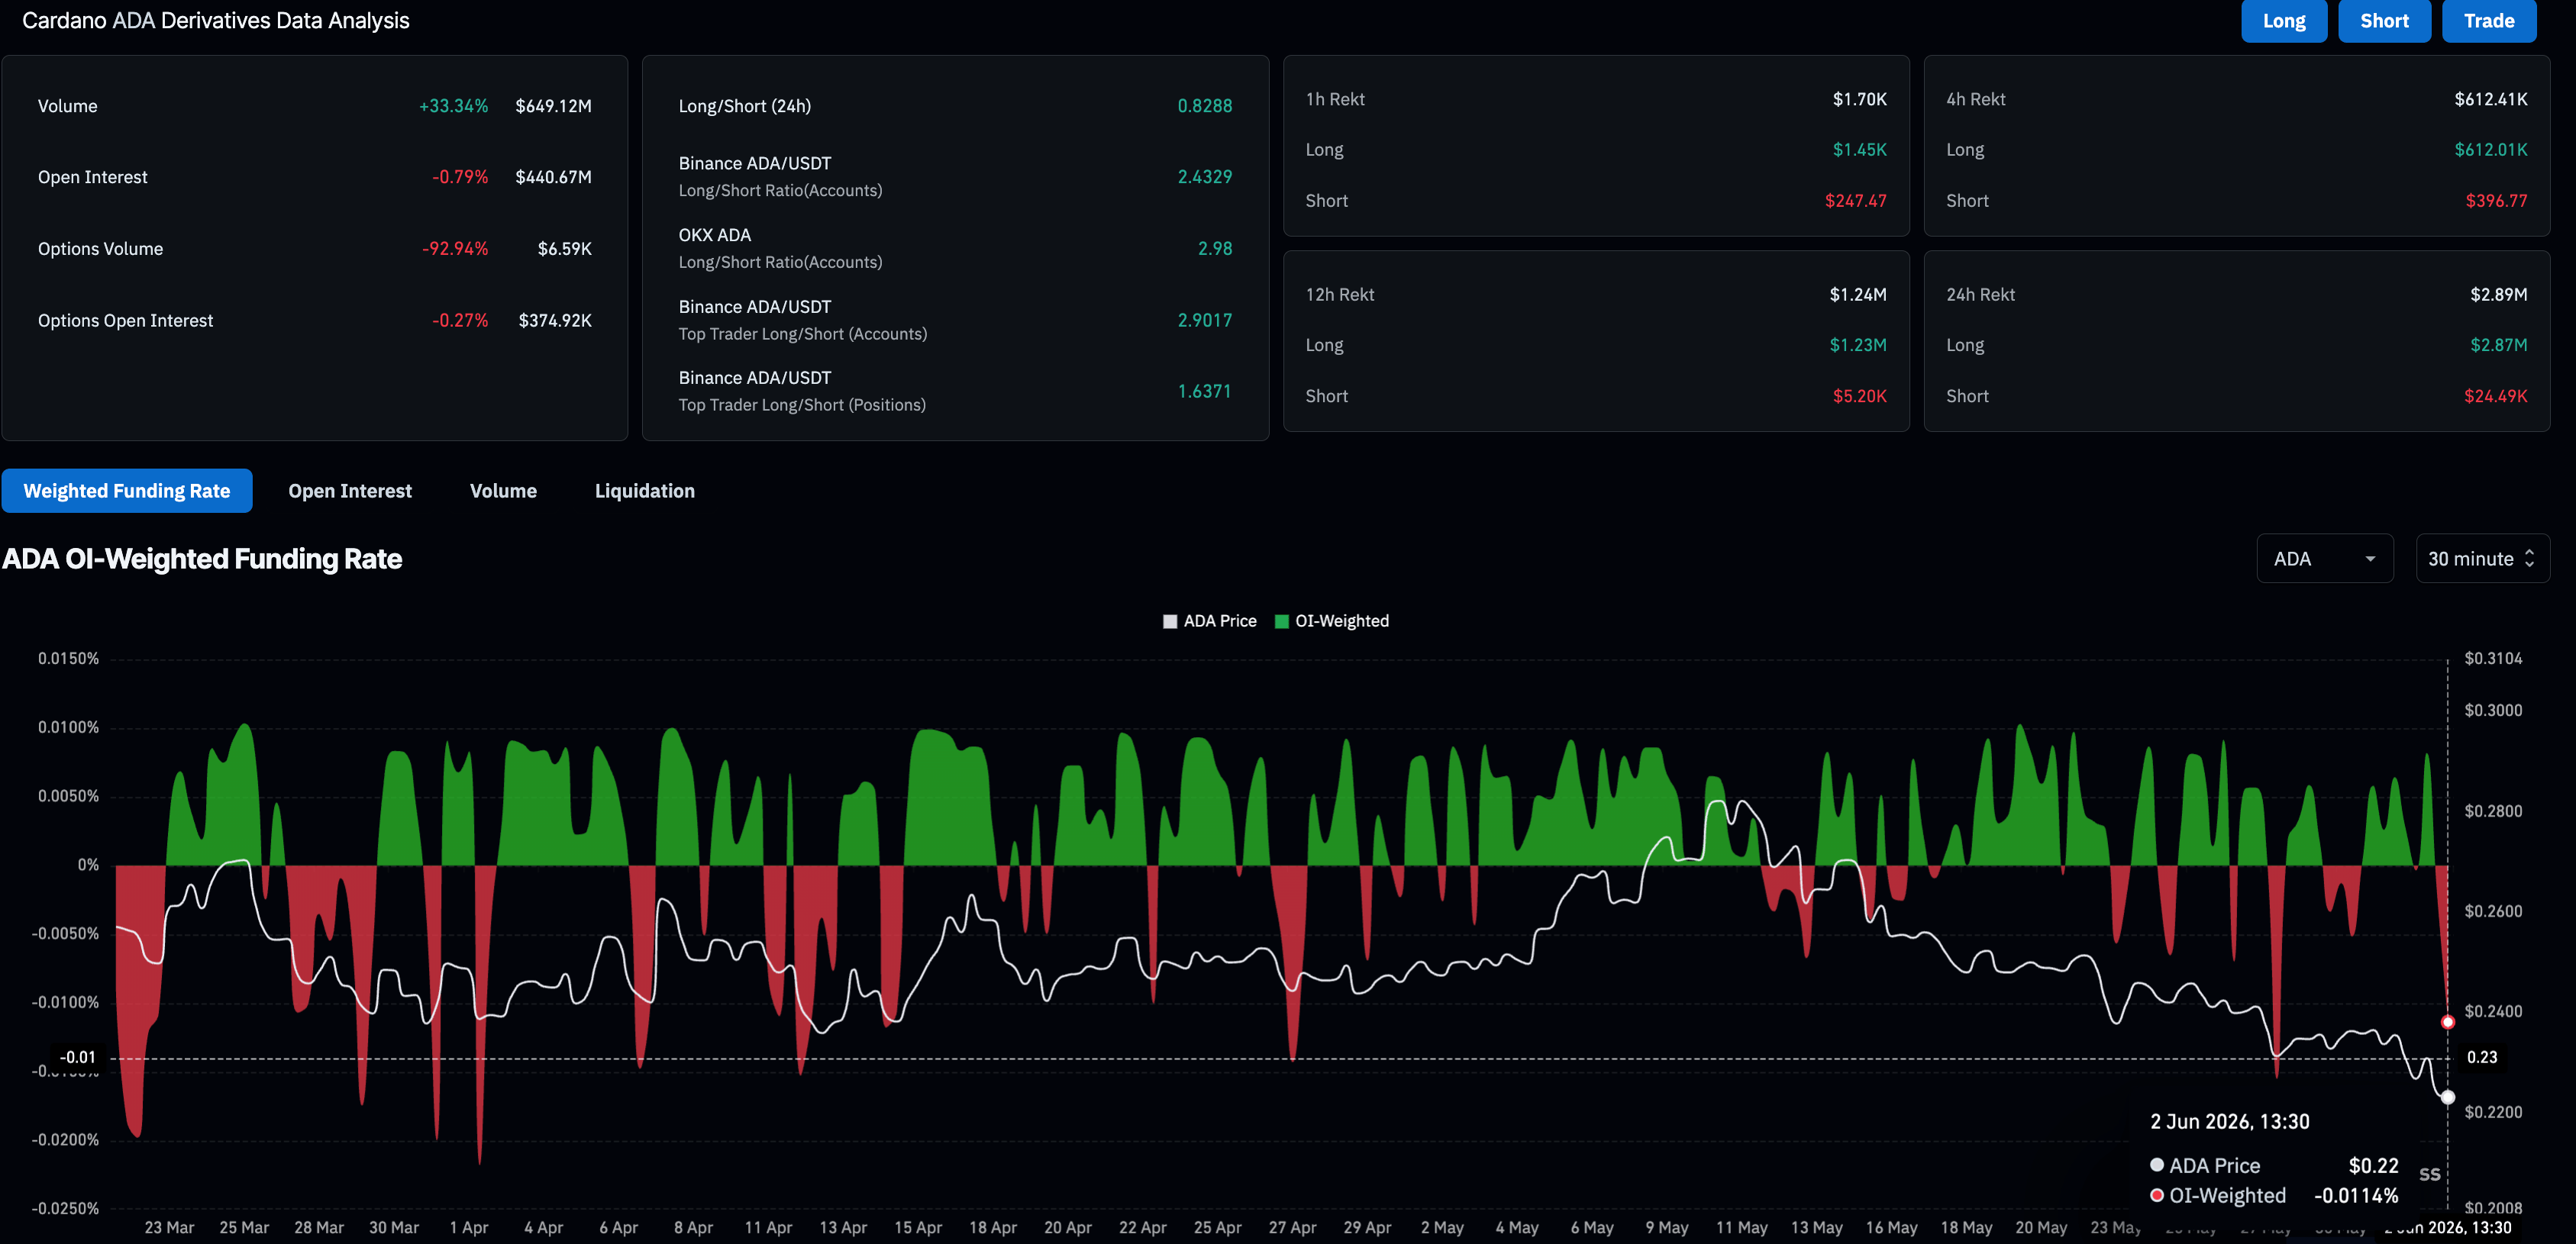
Retail demand for Cardano has weakened significantly as the ADA price extends its decline for the fourth consecutive week. CoinGlass data show that ADA futures recorded $2.89 million in total liquidations over the last 24 hours, with $2.87 million in long liquidations, pointing to a clear sell-side dominance.
At the same time, the ADA Open Interest (OI) – which tracks the notional value of outstanding ADA contracts – has dropped roughly 1% to $440.67 million, indicating that traders are reducing their risk exposure in ADA futures. That said, the funding rate sees a sharp drop to -0.0114% as traders are biased toward short-sided positional building, given the short-term bearish dominance.
Technical outlook: How low will Cardano price go?
Cardano continues its steady decline after a reversal at the 100-day Exponential Moving Average (EMA) on May 10. ADA is down over 20% in slightly over three weeks, slipping below $0.2300. From a technical perspective, Cardano is capped below its 50- and 100-day EMAs at $0.2501 and $0.2309, respectively. The alignment of these EMAs reinforces a bearish backdrop.
That said, the Relative Strength Index (RSI) at roughly 29 on the daily chart signals oversold conditions and hints that downside momentum, though dominant, could be stretched. Meanwhile, the Moving Average Convergence Divergence (MACD) slips deeper into the negative territory below its signal and zero lines, renewing the red histogram bar and reaffirming the bearish tone.
The immediate support for ADA lies at the February 6 low of $0.2205, close to the June 10 low of $0.2200. If ADA clears below this round figure, it would signal the lowest price in five years, matching the level seen on January 5, 2021. In such a case, the S1 and S2 Pivot Point levels at $0.2129 and $0.1901, respectively, could serve as support levels.
On the topside, initial resistance emerges at the 50-period EMA near $0.2501, followed by the 100-period EMA at $0.2709.
(The technical analysis of this story was written with the help of an AI tool.)
Crypto ETF FAQs
An Exchange-Traded Fund (ETF) is an investment vehicle or an index that tracks the price of an underlying asset. ETFs can not only track a single asset, but a group of assets and sectors. For example, a Bitcoin ETF tracks Bitcoin’s price. ETF is a tool used by investors to gain exposure to a certain asset.
Yes. The first Bitcoin futures ETF in the US was approved by the US Securities & Exchange Commission in October 2021. A total of seven Bitcoin futures ETFs have been approved, with more than 20 still waiting for the regulator’s permission. The SEC says that the cryptocurrency industry is new and subject to manipulation, which is why it has been delaying crypto-related futures ETFs for the last few years.
Yes. The SEC approved in January 2024 the listing and trading of several Bitcoin spot Exchange-Traded Funds, opening the door to institutional capital and mainstream investors to trade the main crypto currency. The decision was hailed by the industry as a game changer.
The main advantage of crypto ETFs is the possibility of gaining exposure to a cryptocurrency without ownership, reducing the risk and cost of holding the asset. Other pros are a lower learning curve and higher security for investors since ETFs take charge of securing the underlying asset holdings. As for the main drawbacks, the main one is that as an investor you can’t have direct ownership of the asset, or, as they say in crypto, “not your keys, not your coins.” Other disadvantages are higher costs associated with holding crypto since ETFs charge fees for active management. Finally, even though investing in ETFs reduces the risk of holding an asset, price swings in the underlying cryptocurrency are likely to be reflected in the investment vehicle too.
Author

Vishal Dixit
FXStreet
Vishal Dixit holds a B.Sc. in Chemistry from Wilson College but found his true calling in the world of crypto.



