Bonk Price Forecast: BONK eyes breakout rally as retail demand rises
- Bonk extends rally on Tuesday, advancing the 7% gains from the previous day, with bulls eyeing the overhead trendline breakout.
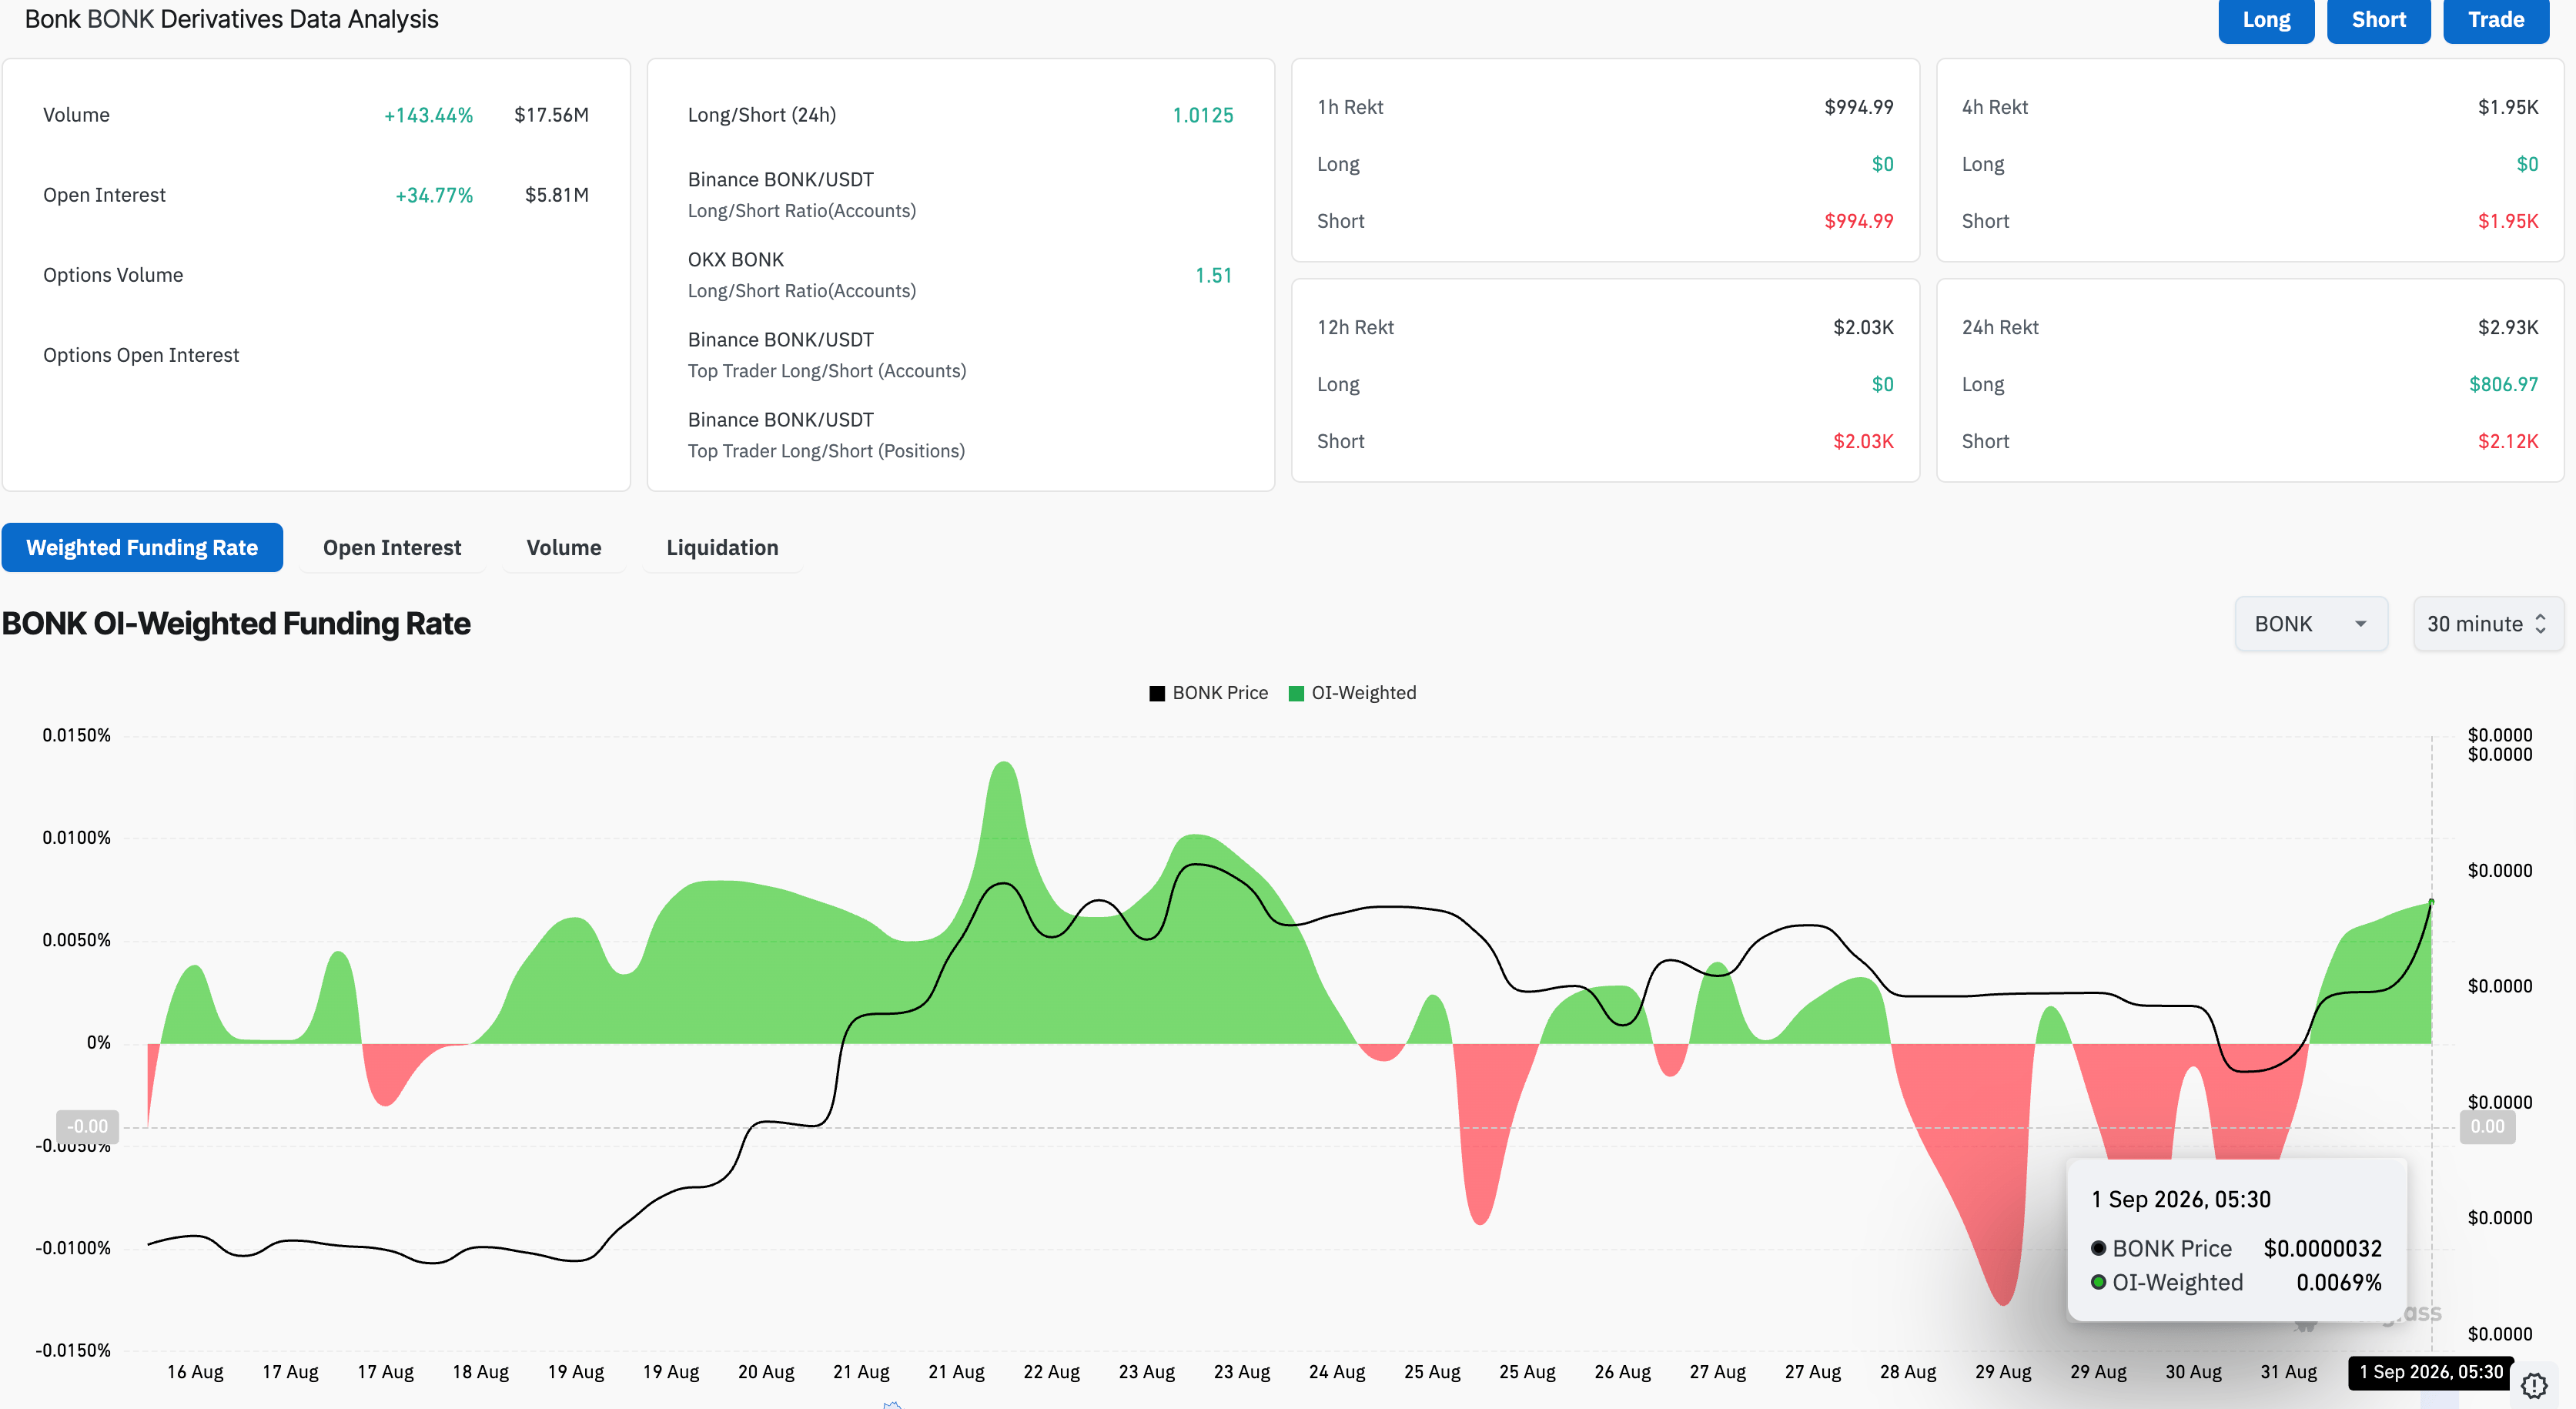
- BONK derivatives see a nearly 35% rise in the notional value of active contracts amid positive funding rates.
- The technical outlook for BONK indicates an upside bias, with momentum indicators showing firm buying pressure.

Bonk (BONK) price is up 7% on Tuesday, building on the previous day’s 7% gains to reclaim the 14% loss from last week. A Solana-based meme coin is gaining retail attention as speculative, leverage-driven demand has lifted BONK Open Interest by 35% over the last 24 hours. The technical outlook is bullish, with upside momentum gaining traction.
Retail demand suggests capital inflow
Bonk is gaining retail demand as the broader crypto market's recovery renews capital inflows into meme coins. CoinGlass data shows the BONK futures Open Interest (OI) is up 7% over the last 24 hours, suggesting a surge in the notional value of active BONK perpetual contracts. At the same time, the OI-weighted funding rate at 0.0069% suggests that traders are willing to buy long positions at a premium.
Technical outlook: BONK eyes falling channel pattern breakout
BONK shows a steady recovery above $0.00000300 on Tuesday, reclaiming 14% of last week's losses. BONK maintains a near-term bullish bias as price tests a bullish breakout of the resistance trendline connecting the May 10 and August 22 highs near $0.00000338.
From a technical perspective, the overhead trendline forms a falling channel pattern on the daily chart, with the lower boundary trendline near $0.00000185. A confirmed breakout above $0.00000338 could target the 50% retracement of the downswing from $0.00000831 to $0.00000222, at $0.00000430.
Momentum holds steady, with the Relative Strength Index (RSI) rising to 59 from neutral levels on the daily chart, suggesting upside potential. At the same time, the Moving Average Convergence Divergence (MACD) and signal line uphold a positive slope above zero, suggesting steady bullish momentum.
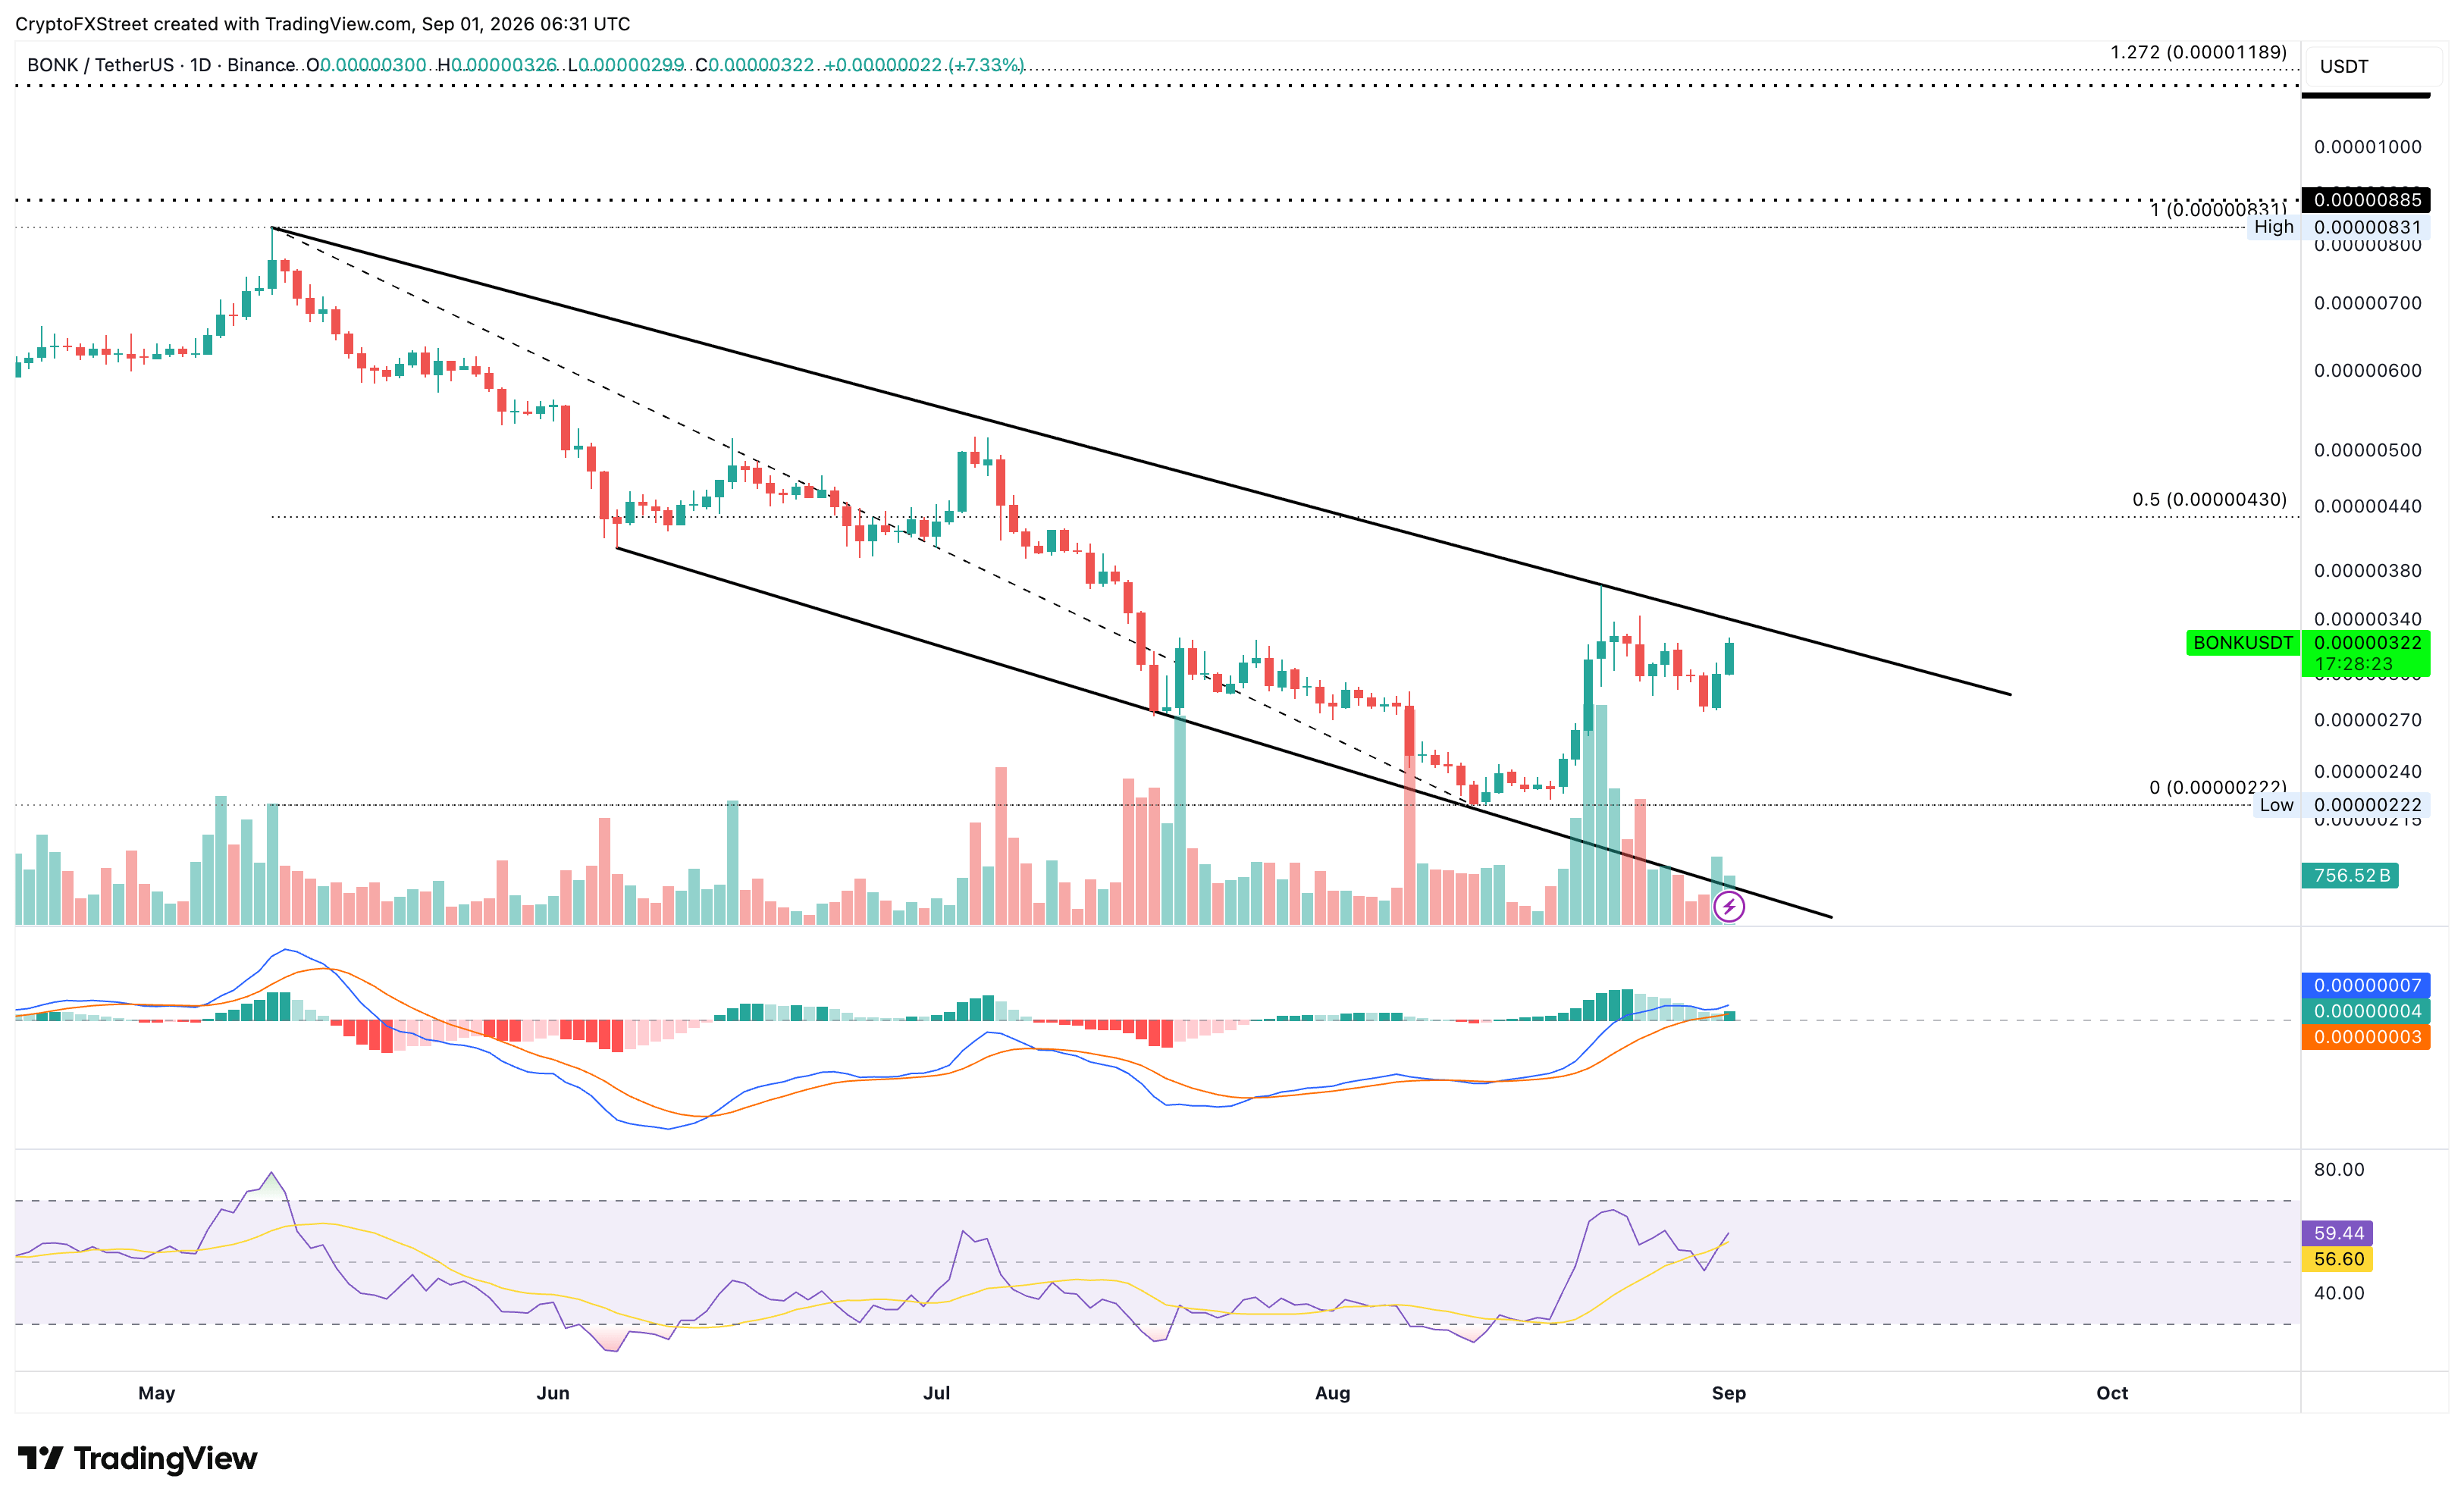
On the downside, a potential reversal in BONK below $0.00000275 could extend its decline toward the $0.00000222 swing low.
(The technical analysis of this story was written with the help of an AI tool. Know more.)
Author

Vishal Dixit
FXStreet
Vishal Dixit holds a B.Sc. in Chemistry from Wilson College but found his true calling in the world of crypto.



