BNB Price Forecast: Bearish channel breakdown, muted ETF flows point to deeper losses
- BNB price trades in red on Tuesday after closing below the lower support boundary of the parallel channel the previous week.
- Muted ETF flows and weakening derivatives metrics support a bearish outlook.
- Technical outlook suggests BNB could extend its decline toward the $488 support level.

BNB (BNB), formerly known as Binance Coin, remains under pressure, trading below $555 on Tuesday after closing below the lower boundary of its parallel channel last week, confirming a bearish technical breakdown. Muted institutional and weakening derivatives activity continue to weigh on sentiment. Meanwhile, the technical outlook suggests sellers could drive BNB toward the next key support at $488 if downside momentum persists.
Muted institutional demand
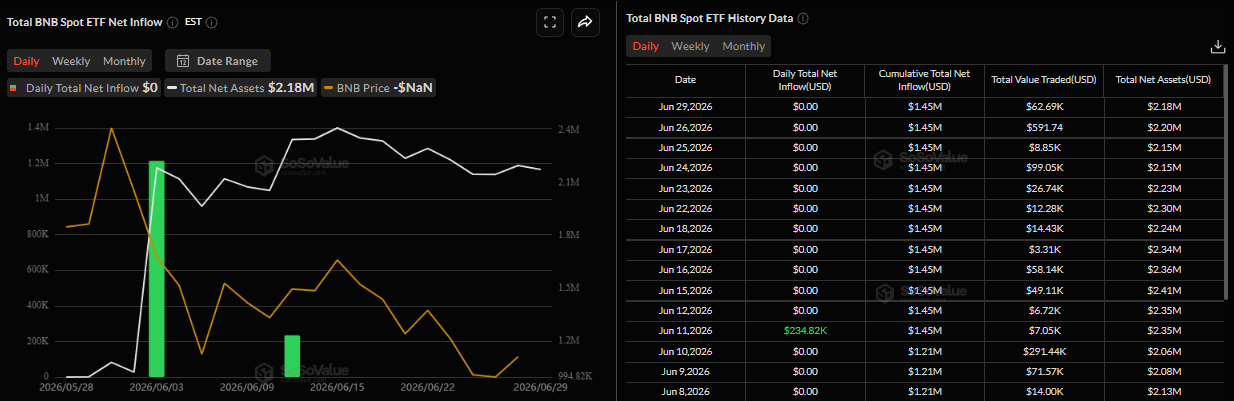
SoSoValue data shows that BNB’s spot Exchange-Traded Funds (ETFs) have remained largely silent since their launch on May 28, indicating a lack of meaningful institutional demand for the token. This muted demand fails to provide a cushion against falling BNB prices.
Derivatives metrics support a bearish bias
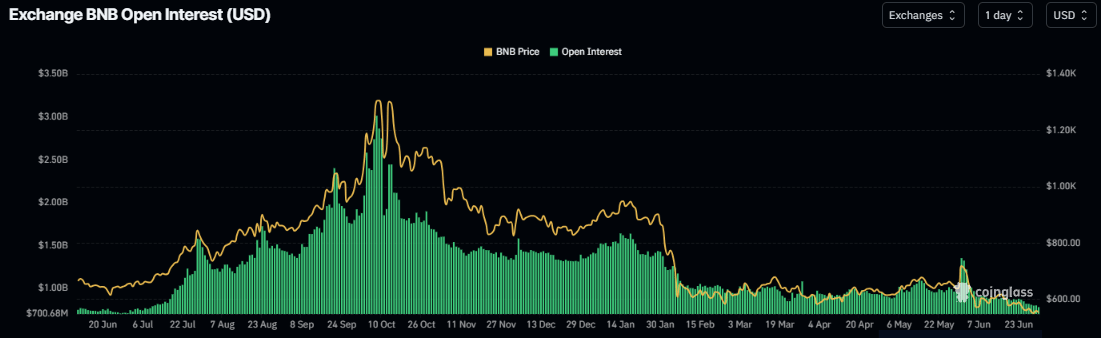
BNB’s derivatives metrics support a negative outlook. BNB’s futures Open Interest (OI) dropped to $780.77 million on Tuesday after a mild rise in early June but has been continuously falling since mid-January. This drop in OI reflects waning investor participation and projects a bearish outlook.
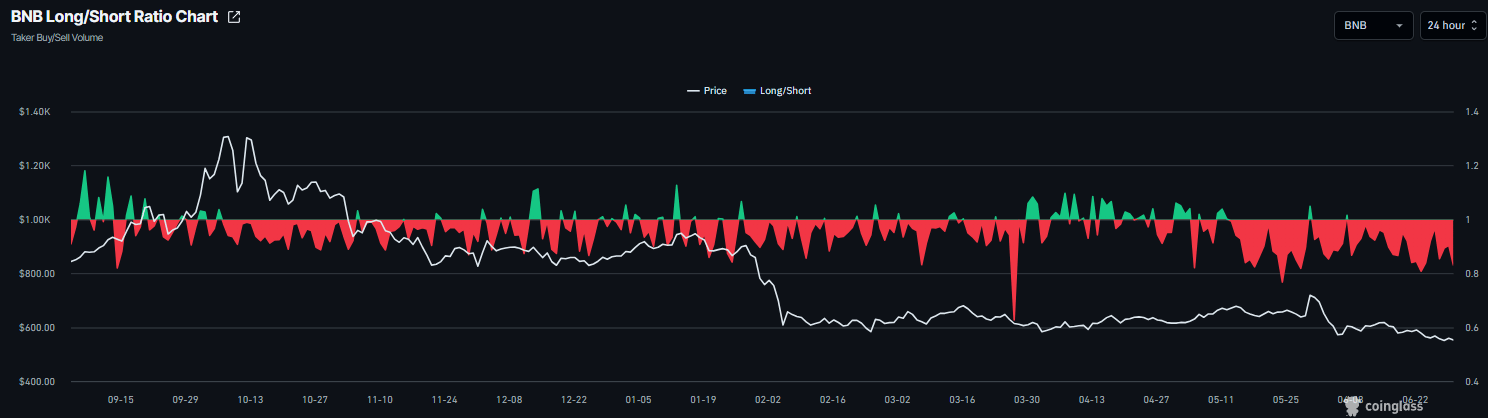
In addition, CoinGlass’ long-to-short ratio for BNB reads 0.83 on Tuesday, nearing its lowest level in over a month. This ratio, being below one, reflects bearish sentiment in the market, as more traders are betting on the asset’s price to fall.
BNB Price Forecast: BNB confirms a bearish technical breakdown
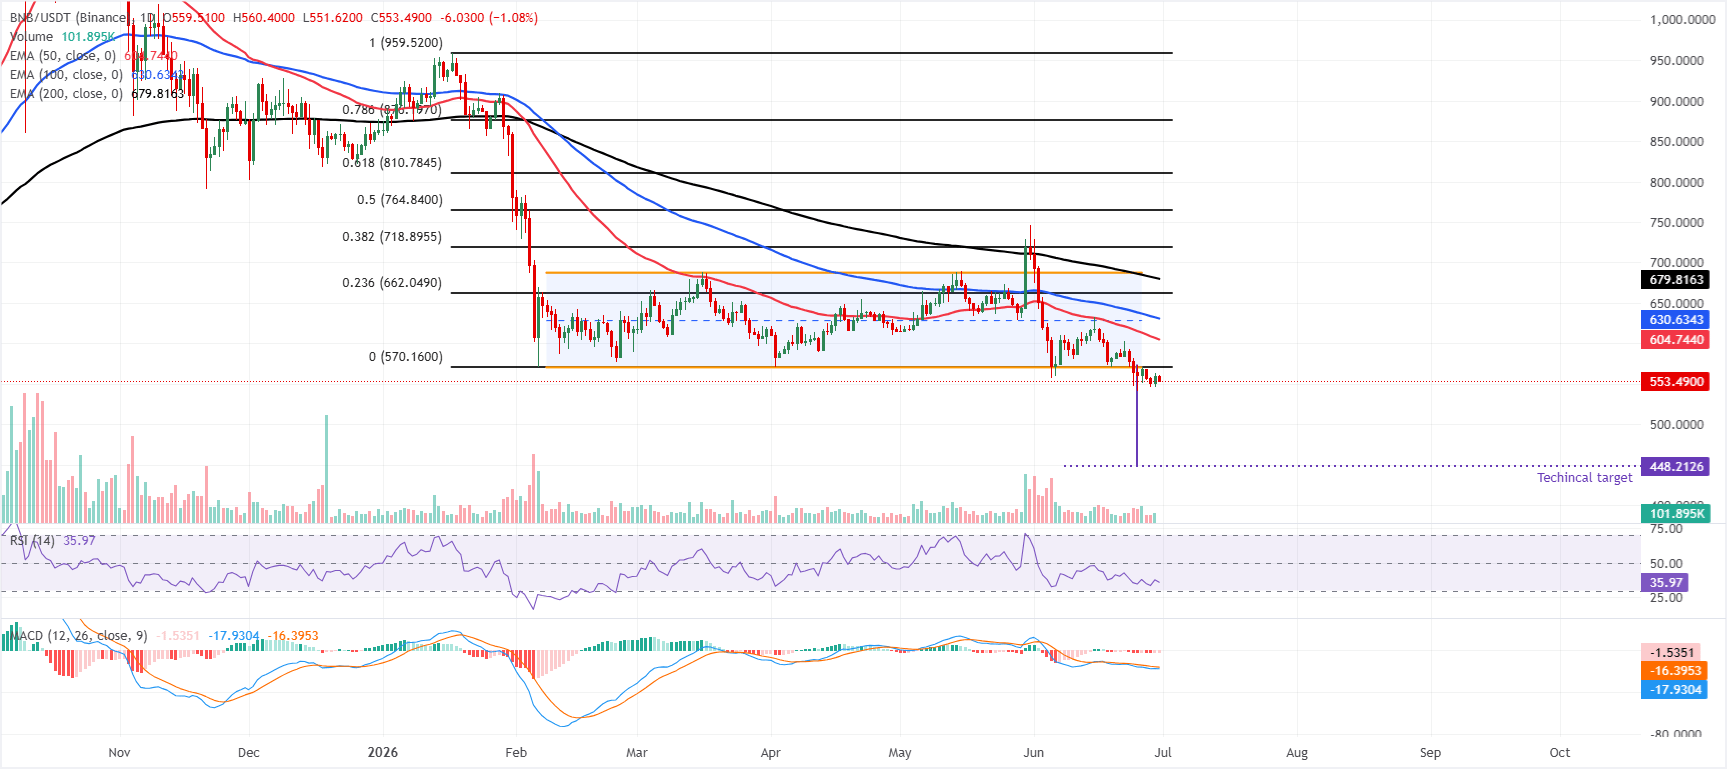
BNB price trades at $553 on Tuesday, extending a bearish phase after closing below the lower boundary near $570 in the previous week, confirming a technical breakdown. Moreover, BNB is extending its retreat well below the 50-day, 100-day, and 200-day Exponential Moving Averages (EMAs) at $604.74, $630.63, and $679.81, respectively, which collectively cap the upside.
The Relative Strength Index (RSI) near 35 suggests emerging oversold conditions, and the Moving Average Convergence Divergence (MACD) indicator remains negative. Still, it is no longer deteriorating sharply, hinting at weakening downside momentum rather than a confirmed reversal.
On the downside, the technical target is at $488.21 (based on the distance between the channel extrapolated from the breakdown point). However, BNB could find support around the $500 psychological level before gravitating toward its channel breakdown target.
On the topside, initial resistance is now seen at the broken lower channel boundary at $570, followed by the 50-day EMA at $604.74 and the 100-day EMA at $630.63, with a more meaningful barrier at the 200-day EMA at $679.81.
(The technical analysis of this story was written with the help of an AI tool.)
Author

Manish Chhetri
FXStreet
Manish Chhetri is a crypto specialist with over four years of experience in the cryptocurrency industry.



