Bitcoin Technical Analysis: BTC/USD vulnerable to another fall
- Bitcoin price on Thursday is further cooling, down in the session 1.6%.
- BTC/USD sees enough bearish confluences to suggest another fall in around the corner.

BTC/USD 15-minute chart
- Price action moving within a pennant pattern structure, subject to a potential break lower.
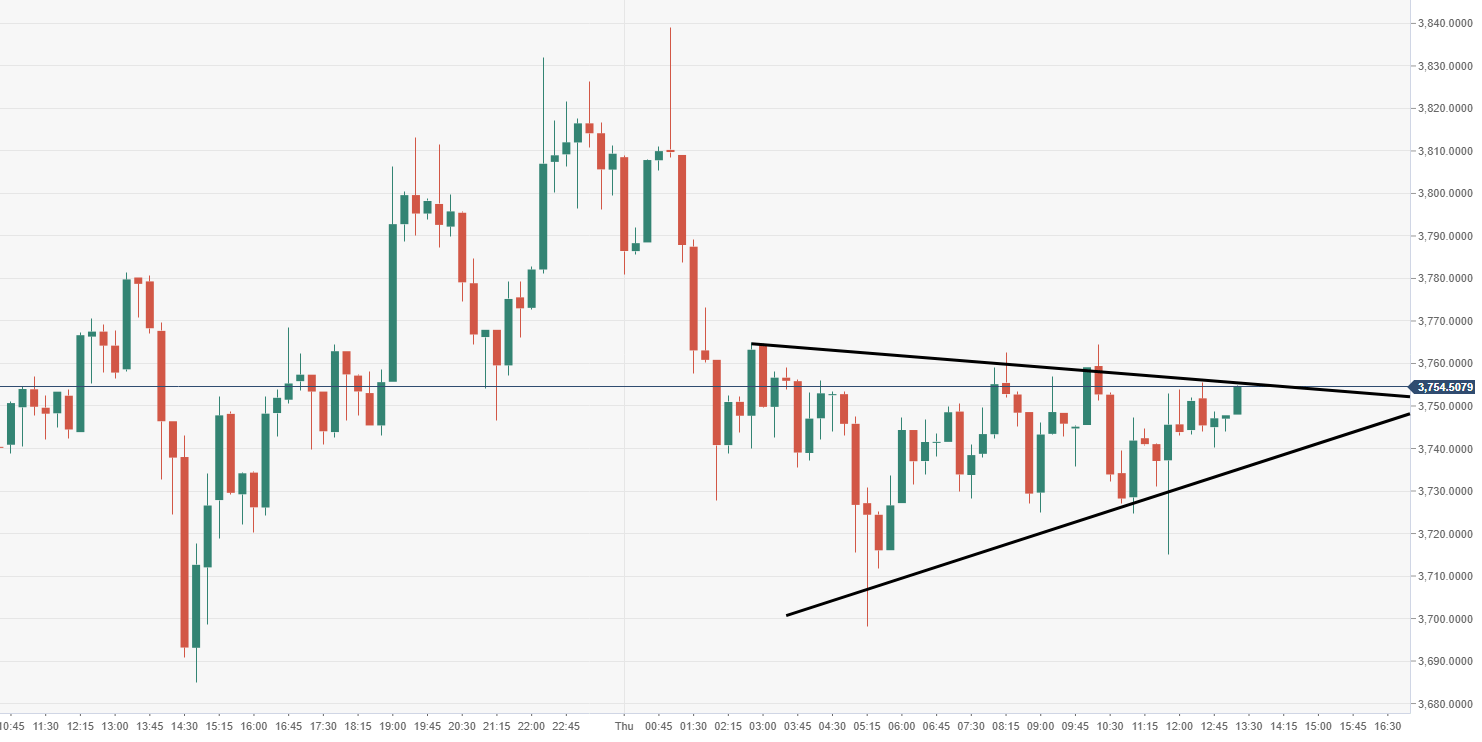
Spot rate: 3748.02
Relative change: -1.66%
High: 3839.16
Low: 3698.12
Trend: Bearish
Support 1: 3710.70, daily pivot point support.
Support 2: 3612.05, daily pivot point support.
Support 3: 3539.02, daily pivot point support.
Resistance 1: 3882.37, daily pivot point resistance.
Resistance 2: 3955.39, daily pivot point resistance.
Resistance 3: 4054.05, daily pivot point resistance.
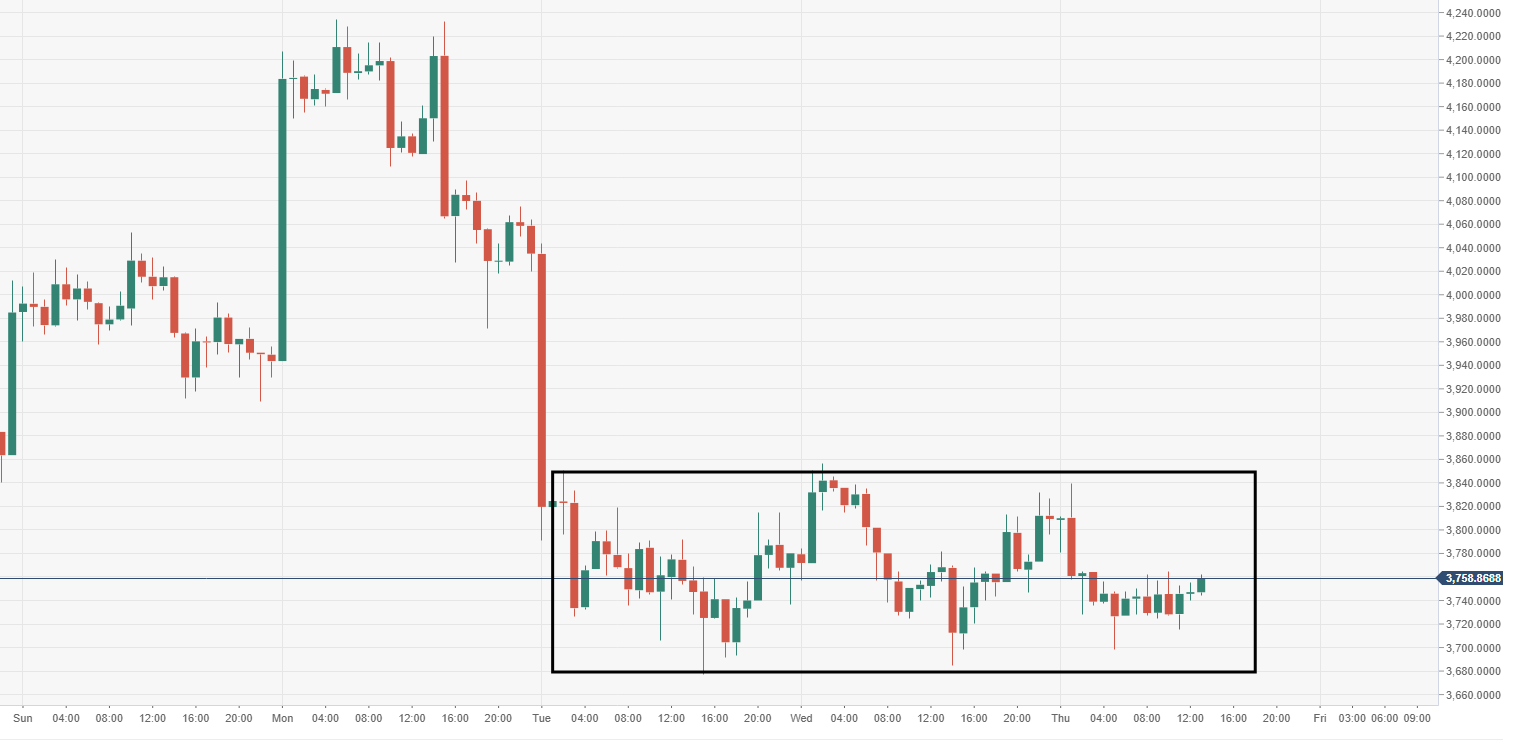
BTC/USD 60-minute chart
- BTC/USD via the 60-minute view is moving within a range-block, breakout could soon be seen south.
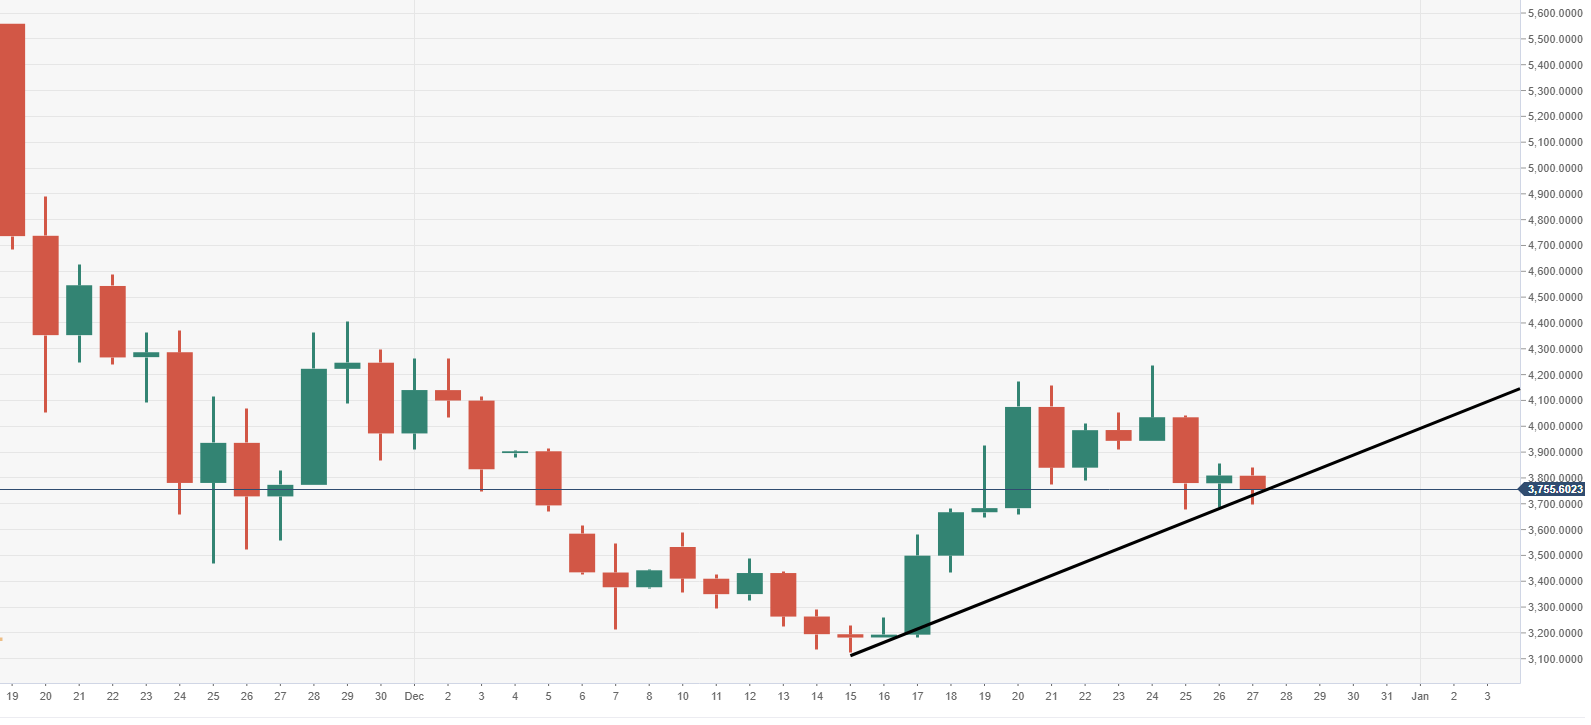
BTC/USD daily chart
- Price supported for now by an ascending trend line, running since 15th December.
Author

Ken Chigbo
Independent Analyst
Ken has over 8 years exposure to the financial markets. He started his career as an analyst, covering a variety of asset classes; forex, fixed income, commodities and equities.


