Bitcoin Technical Analysis: BTC/USD the breakout is due
- Bitcoin trading down on Thursday 2% towards the latter part of the session.
- BTC/USD has narrowing further within a bearish pennant, this can be witnessed across a number of altcoins trading behaviors.
- As seen via the 60-minute chart view, price action is very much tight, very narrow range, subject to a potential explosive move.

BTC/USD 4-hour chart
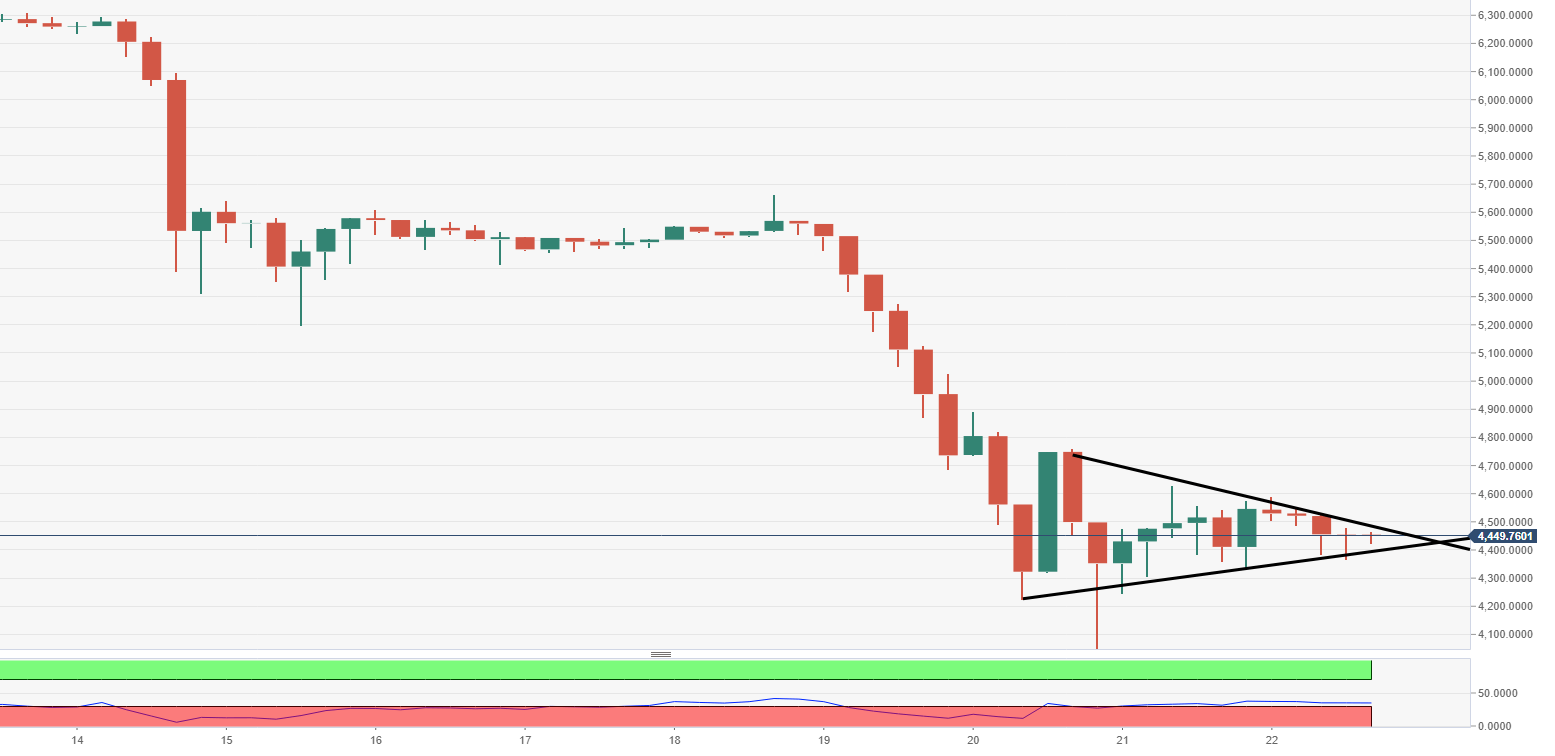
Spot rate: 4452.10
Relative change: -2.10%
High: 4588.26
Low: 4364.40
Trend: Bearish
Support 1: 4400.00, lower part of pennant.
Support 2: 4319.18, daily pivot point support.
Support 3: 4092.39, daily pivot point support.
Resistance 1: 4481.65, upper part of pennant.
Resistance 2: 4700.18, daily pivot point resistance.
Resistance 3: 4854.37, daily pivot point resistance.
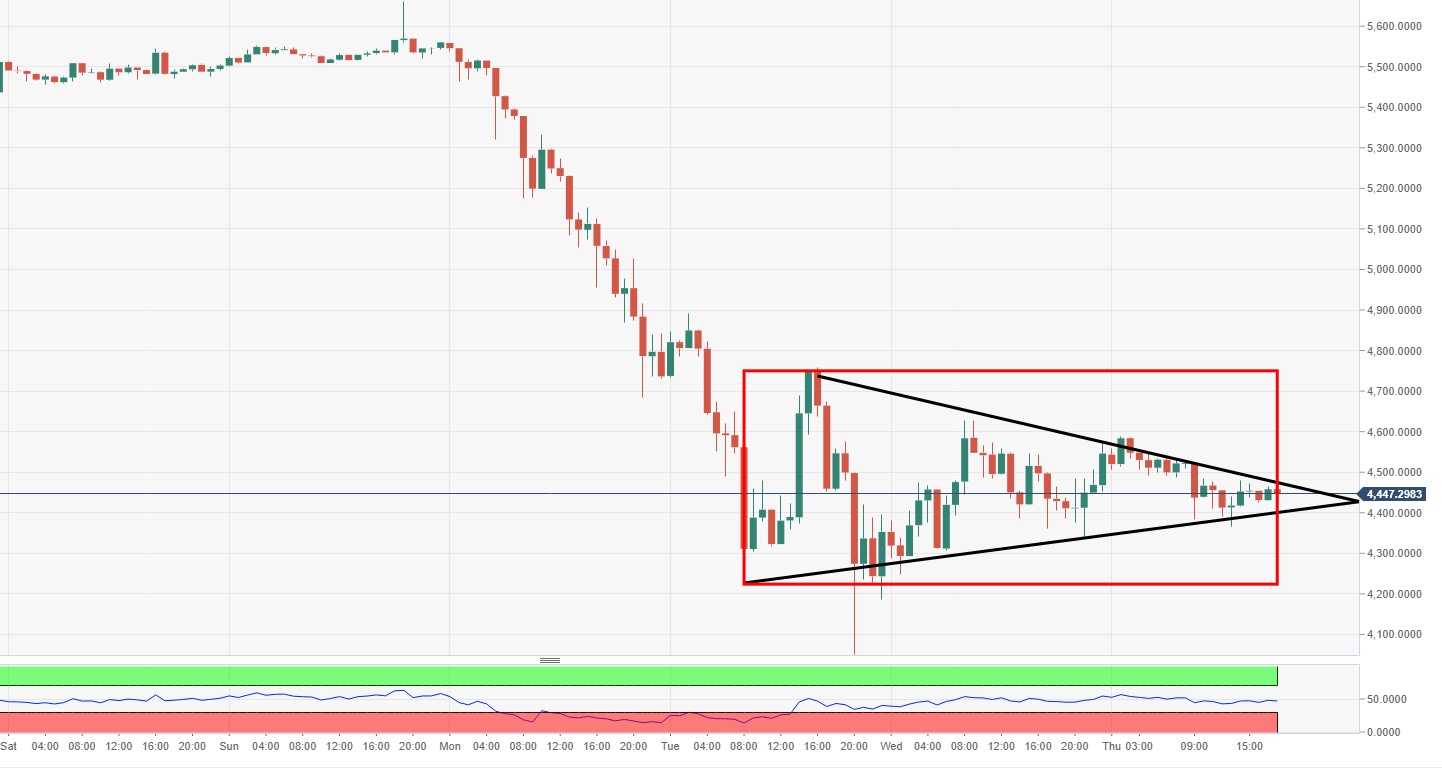
BTC/USD 60-minute chart view
- BTC/USD price action narrowing greatly, subject to breakout , indicators in favor of market bears presently.
Author

Ken Chigbo
Independent Analyst
Ken has over 8 years exposure to the financial markets. He started his career as an analyst, covering a variety of asset classes; forex, fixed income, commodities and equities.


