Bitcoin Technical Analysis: BTC/USD stuck in highway to hell, $3000 now eyed
- Bitcoin price nursing deep losses of over 6% in the session on Tuesday.
- BTC/USD moving within fast channel to the deep south, as covered in yesterday's article.
- Price manages to catch some relief on the lower supporting trend line of the channel.

BTC/USD 60-minute chart
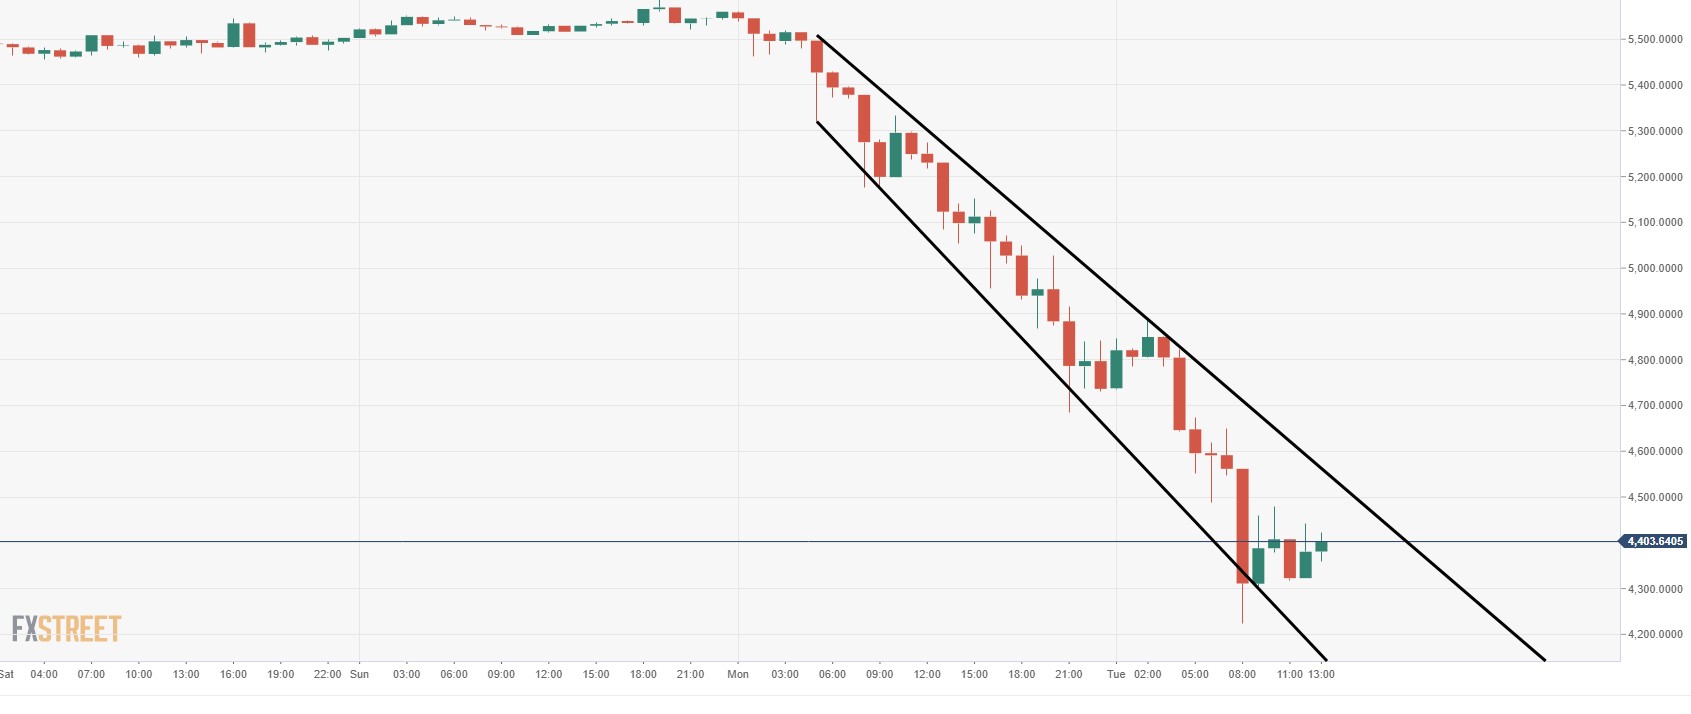
Spot rate: 4407.77
Relative change: -6.00%
High: 4887.54
Low: 4227.02
Trend: Bearish
Support 1: 4426.88, daily pivot point support.
Support 2: 4310.02, lower support of channel.
Support 3: 3550.70, daily pivot point support.
Resistance 1: 4500.00, 60-minute resistance.
Resistance 2: 4585.00, upper part of channel.
Resistance 3: 5303.50, daily pivot point support.
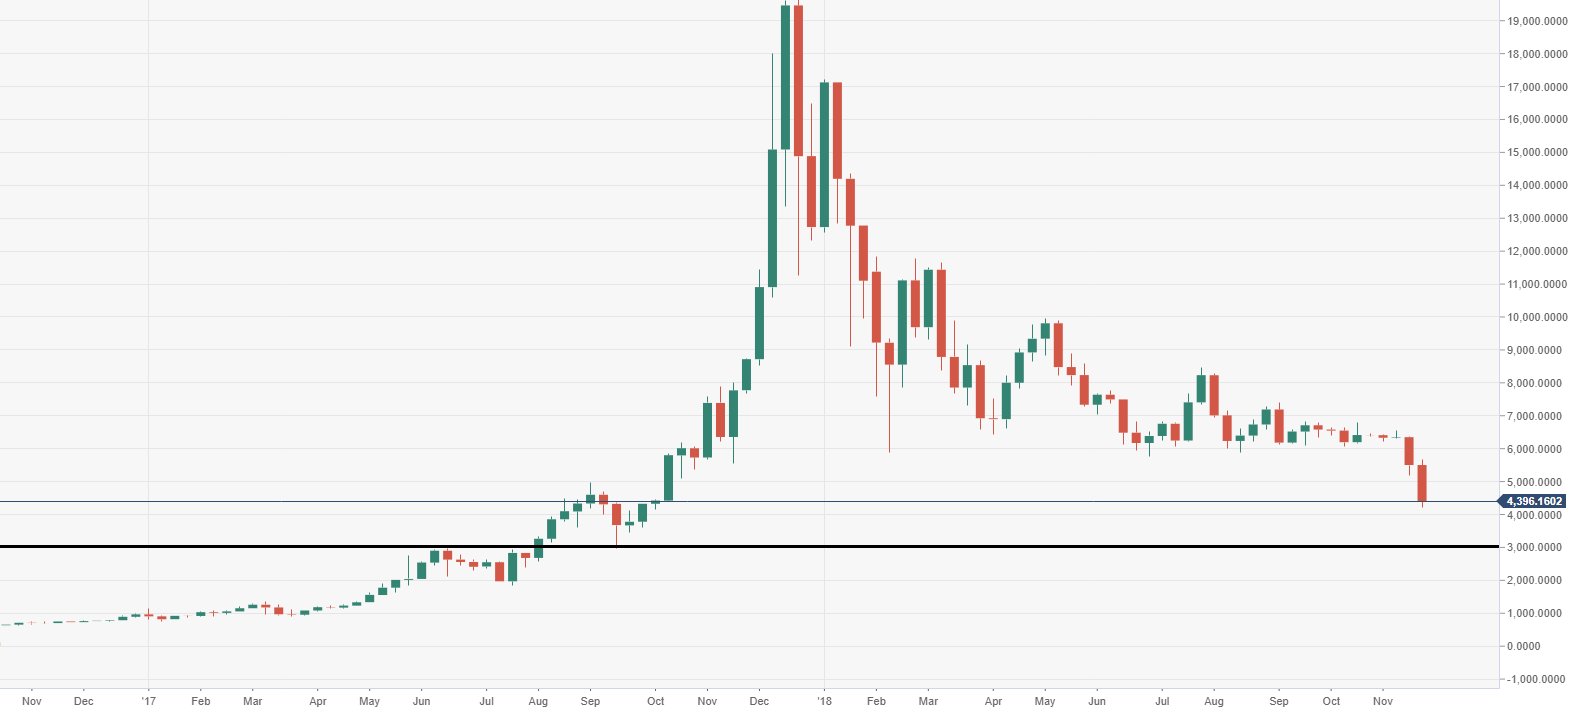
BTC/USD weekly chart
- Weekly chart view for BTC/USD looks worryingsome for the bulls, next major level eyed would be $3000.
Author

Ken Chigbo
Independent Analyst
Ken has over 8 years exposure to the financial markets. He started his career as an analyst, covering a variety of asset classes; forex, fixed income, commodities and equities.


