|

Bitcoin technical analysis: BTC/USD critical daily trend line prevents devastation for now

  • Bitcoin price is trading down some 11% in the second half of the session on Friday. 
  • BTC/USD price action via the daily chart view is testing a critical daily trend line to the downside. 
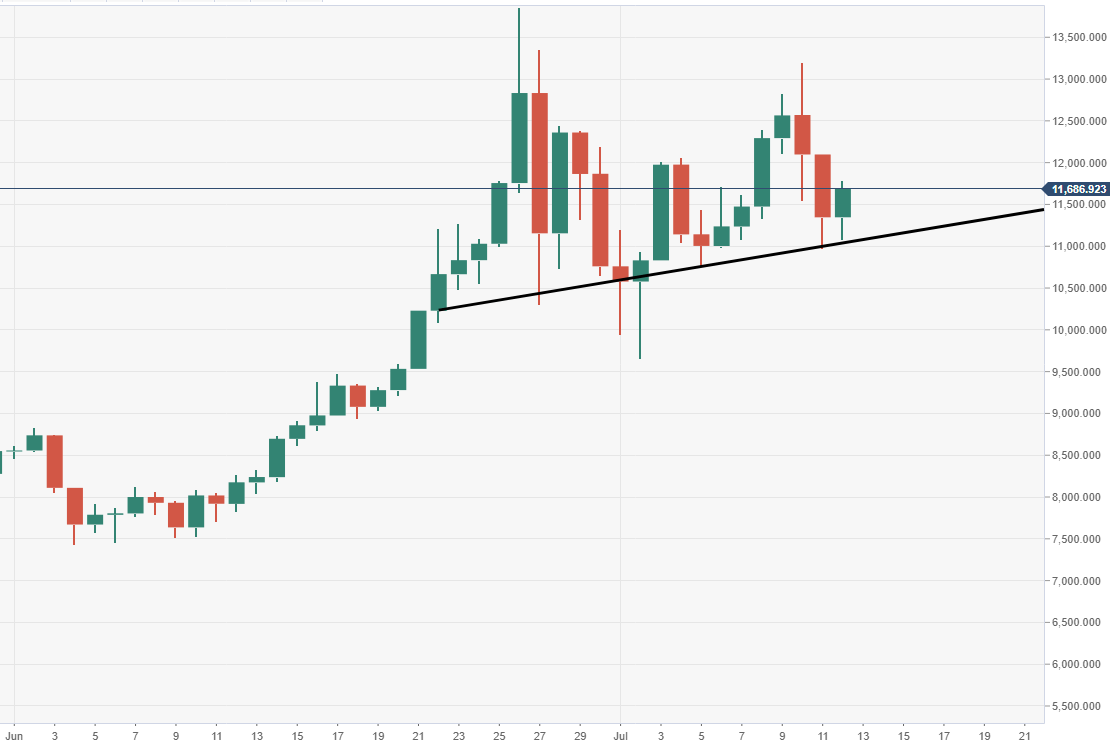
  • The noted support can be seen tracking around $11,000 price mark. 

Spot rate:                11,682.06 

Relative change:      +2.95%

High:                        11,785.39

Low:                         11,085.27

BTC/USD

Overview
Today last price11686.03
Today Daily Change340.12
Today Daily Change %3.00
Today daily open11345.91
 
Trends
Daily SMA2011490.14
Daily SMA509659.22
Daily SMA1007758.01
Daily SMA2005758.57
Levels
Previous Daily High12098.98
Previous Daily Low10968.34
Previous Weekly High12198.8
Previous Weekly Low9657.13
Previous Monthly High13862.09
Previous Monthly Low7437.33
Daily Fibonacci 38.2%11400.24
Daily Fibonacci 61.8%11667.07
Daily Pivot Point S110843.17
Daily Pivot Point S210340.43
Daily Pivot Point S39712.53
Daily Pivot Point R111973.81
Daily Pivot Point R212601.72
Daily Pivot Point R313104.46

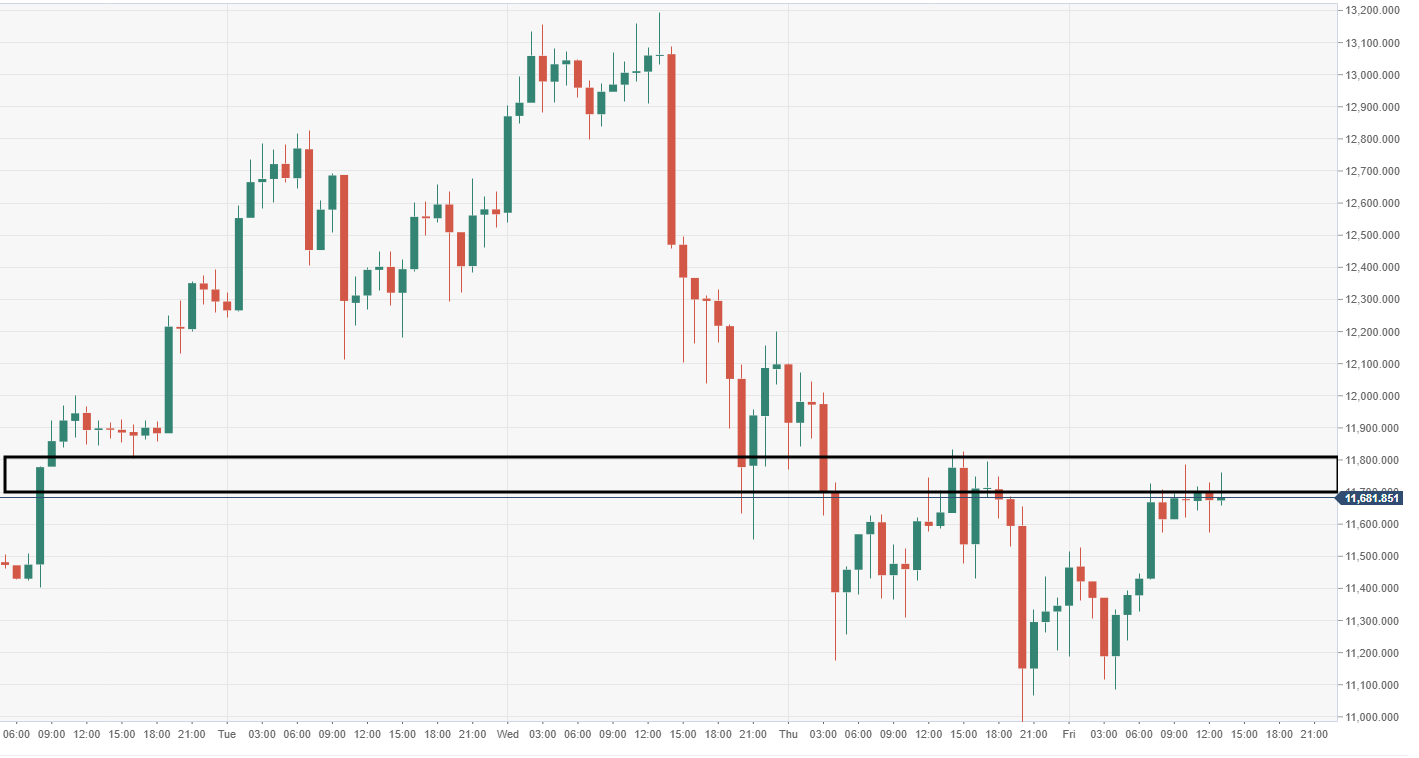
BTC/USD 60-minute chart

  • Upside is capped by a barrier running from $11,600-800 range via the 60-minute.

BTC/USD daily chart

  • Daily ascending trend line stops the bears from causing a chunky wave of selling pressure. 

Author

Ken Chigbo

Ken Chigbo

Independent Analyst

Ken has over 8 years exposure to the financial markets. He started his career as an analyst, covering a variety of asset classes; forex, fixed income, commodities and equities.

More from Ken Chigbo
Share:

Editor's Picks

Crypto's future lies in tokenized real-world assets, not speculation

Atlas Capital CEO Reza Bandi stated that the crypto industry's next major growth phase will be driven by the tokenization of real-world assets rather than speculative trading. In an interview with FXStreet, Bandi identified three factors supporting the expansion of tokenization.

Top 3 Price Prediction: BTC remains vulnerable, ETH weakens further, XRP signals more downside

Bitcoin, Ethereum, and Ripple remain under pressure mid-week, as the broader cryptocurrency market struggles to regain recovery momentum. BTC struggles below $62,000, ETH continues to weaken below $1,650, while XRP’s momentum indicators remain biased toward further downside.

Crypto Overview: Bitcoin is back under $62,000 – Hyperliquid, DeXe lead losses

The broader cryptocurrency market is under pressure with Bitcoin slipping below $62,000 amid the US launching its third wave of strikes on Iran. Hyperliquid and DeXe are leading losses over the last 24 hours, risking the prevailing upward trend.

Bitcoin sell-off pushes over 50% of circulating supply into loss, hinting at market bottom
Bitcoin (BTC) dropped near $61,000 on Tuesday, with the latest sell-off pushing long-term market indicators toward levels historically associated with bear-market bottoms, according to a report by K33 Research.
Bitcoin: After the bloodbath, everyone looks at $60,000
Bitcoin (BTC) hovers above $62,000 at the time of writing on Friday, weighed down by growing risk-off sentiment due to persistent geopolitical tensions in the Middle East and sticky macroeconomic uncertainty. The institutional sell-off continued to wreak havoc on capital flows, with spot Bitcoin Exchange-Traded Funds (ETFs) recording billions in outflows.