Bitcoin Technical Analysis: BTC/USD awaiting its fate
- Bitcoin price is trading in negative territory, down some 0.70% in the second half of the session.
- BTC/USD price action is extending to the downside after it breached and closed below a bearish pennant via the daily chart view.
- The price is running towards its fourth consecutive session in the red.

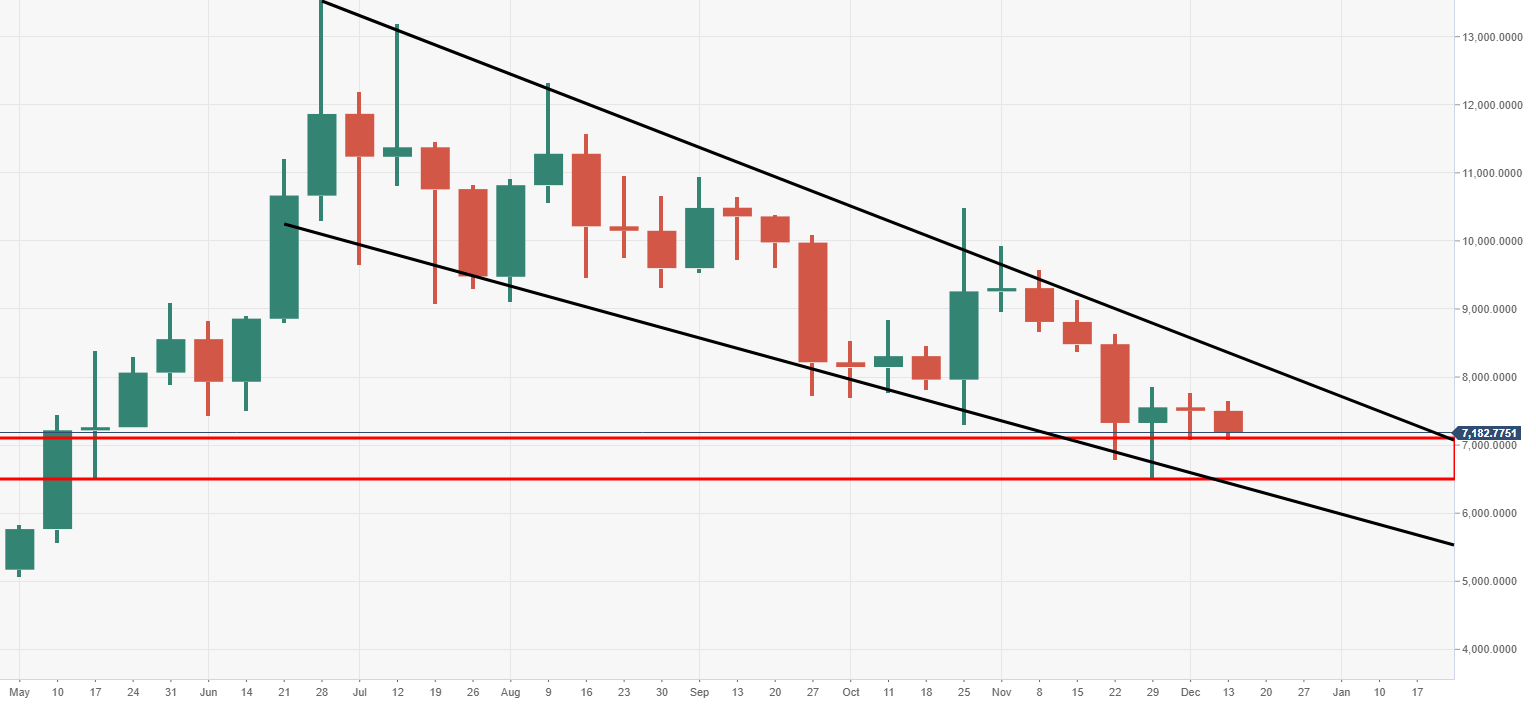
BTC/USD weekly chart
The price is running towards a second consecutive week in the red, as the bears lock in on weekly support zone at $7000-6800 range.
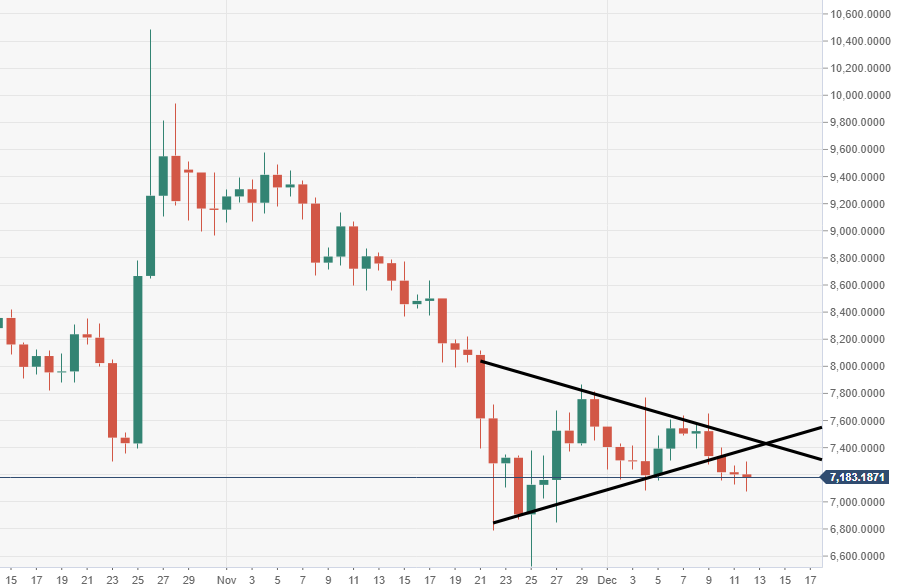
BTC/USD daily chart
Price action is consolidating after the noted pennant breach, subject to further potential moves south.
Spot rate: 7182.20
Relative change: -0.70%
High: 7294.85
Low: 7076.67
Author

Ken Chigbo
Independent Analyst
Ken has over 8 years exposure to the financial markets. He started his career as an analyst, covering a variety of asset classes; forex, fixed income, commodities and equities.
More from Ken Chigbo


