Bitcoin holds up above $54,000 as investor interest ticks up slightly
- Bitcoin price holds above the $54,000 support level tested on Friday.
- US spot Bitcoin ETFs registered outflows last week, while CryptoQuant’s Bitcoin Coinbase Premium Index saw a mild rise.
- On-chain data paints a bearish picture, with falling daily active addresses and a negative Open Interest-weighted funding Rate.

Bitcoin (BTC) recovered slightly on Monday, extending the weekend’s recovery after prices bounced from key support at $54,000 on Friday. This slight recovery amid the mild increase in the Coinbase Premium Index during the weekend. However, the recovery could be short-lived as on-chain data continues to lean to the downside, as shown by falling daily active addresses and a negative OI-weighted funding Rate.
Daily digest market movers: BTC institutional demand wanes
- According to Coinglass data, US spot Bitcoin ETFs recorded a total net outflow of $706.1 million last week, a sign of waning market sentiment. The combined Bitcoin reserves held by the 11 US spot Bitcoin ETFs stands at $40.97 billion, down from $41.68 billion a week earlier.
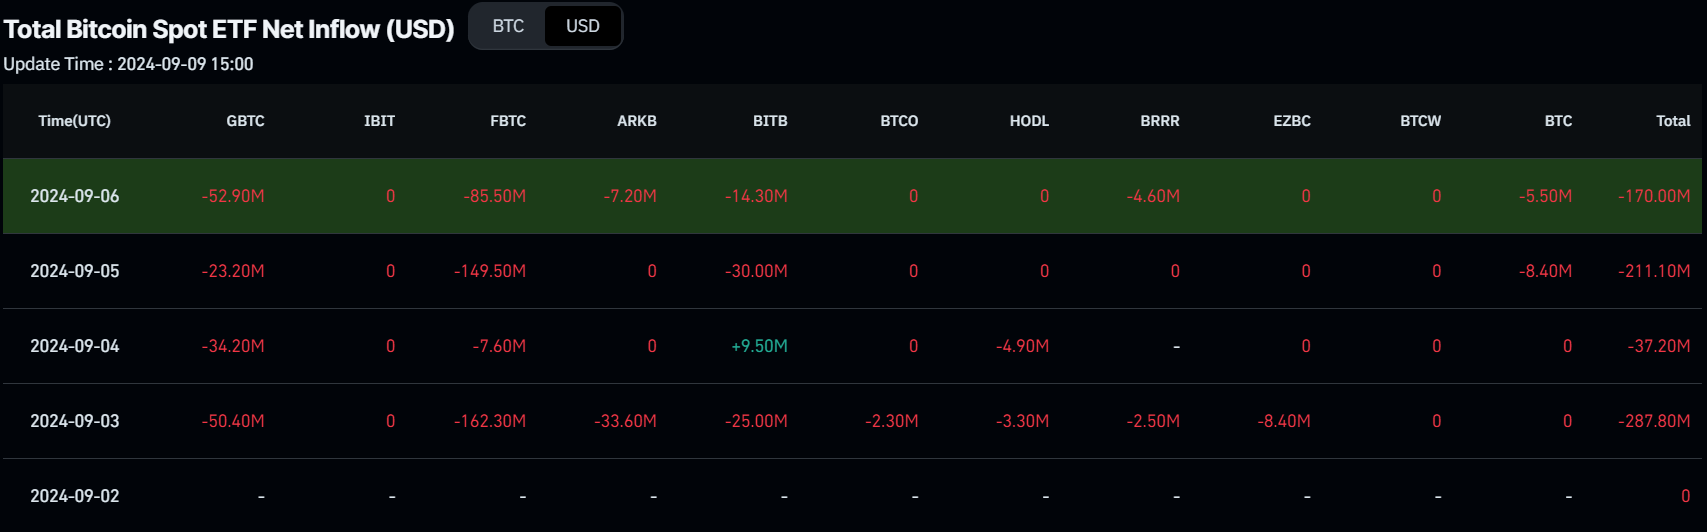
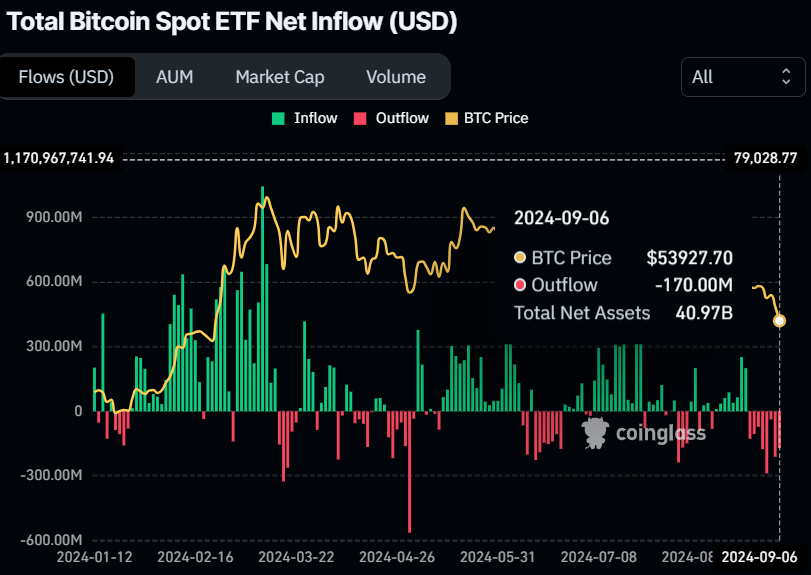
Bitcoin Spot ETF Net Inflow chart
- Santiment’s Daily Active Addresses index, which tracks network activity over time, also paints a bearish picture for Bitcoin. A rise in the metric signals greater blockchain usage, while declining addresses point to lower demand for the network.
In BTC’s case, Daily Active Addresses fell from 726,380 on September 6 to 597,560 on Sunday, extending a downtrend that started in mid-March. This indicates that demand for BTC’s blockchain usage is decreasing, which doesn’t bode well for Bitcoin price.
%20[15.36.22,%2009%20Sep,%202024]-638614808996465028.png)
Bitcoin daily active addresses chart
- According to Coinglass’s OI-Weighted Funding Rate data, the number of traders betting that the price of Bitcoin will slide further is higher than that anticipating a price increase. This index is based on the yields of futures contracts, which are weighted by their open interest rates. Generally, a positive rate (longs pay shorts) indicates bullish sentiment, while negative numbers (shorts pay longs) indicate bearishness.
In the case of Bitcoin, this metric stands at -0.0008%, reflecting a negative rate and indicating that shorts are paying longs. This scenario often signifies bearish sentiment in the market, suggesting potential downward pressure on Bitcoin’s price.
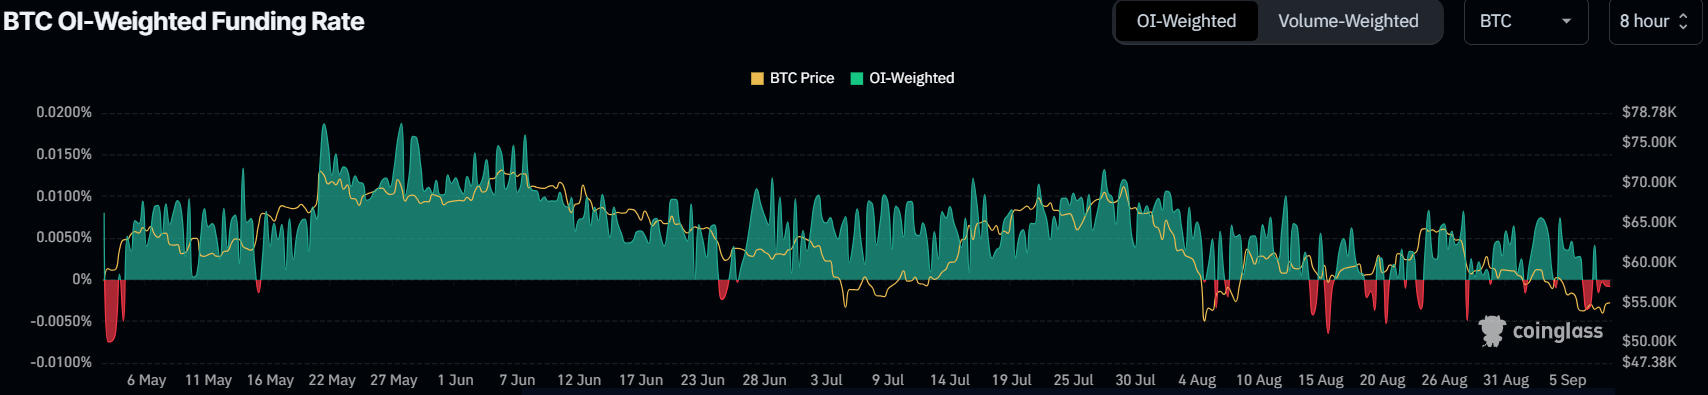
Bitcoin OI-Weighted Funding Rate chart
- CryptoQuant’s Bitcoin Coinbase Premium Index, a key indicator of how large-wallet investors behave, suggests increasing interest from whales in the top crypto. The indicator shows the gap between the Coinbase Pro price (USD pair) and the Binance price (USDT pair). Coinbase Premium data is one of the indicators that shows a sign of whale accumulation, as the Coinbase Pro platform is considered the gateway for institutional investors to purchase cryptocurrencies.
In the case of Bitcoin, the index rose from -0.008 to 0.020 from Saturday to Monday, trading above its 14-day Simple Moving Average (SMA) at -0.009. This mild rise indicates that whales show some sign of accumulation. In addition, investors’ interest in and activity in Coinbase have also increased slightly.
-638614809832686098.png)
Bitcoin Coinbase Premium Index chart
Technical analysis: BTC holds above $54,000
Bitcoin was rejected at $59,560, its 50% price retracement level, on September 2 (drawn from a high in late July to a low in early August) and dropped 8.7% in the next four days. On Saturday, it found support around the $54,000 level, trading slightly above $55,316 on Monday.
If BTC closes below the $54,000 level, it could decline 7% to retest the next daily support at $49,917.
The Relative Strength Index (RSI) and the Awesome Oscillator (AO) momentum indicators on the daily chart trade below their respective neutral levels of 50 and zero, respectively. Both indicators suggest weak momentum and a continuation of the downward trend.
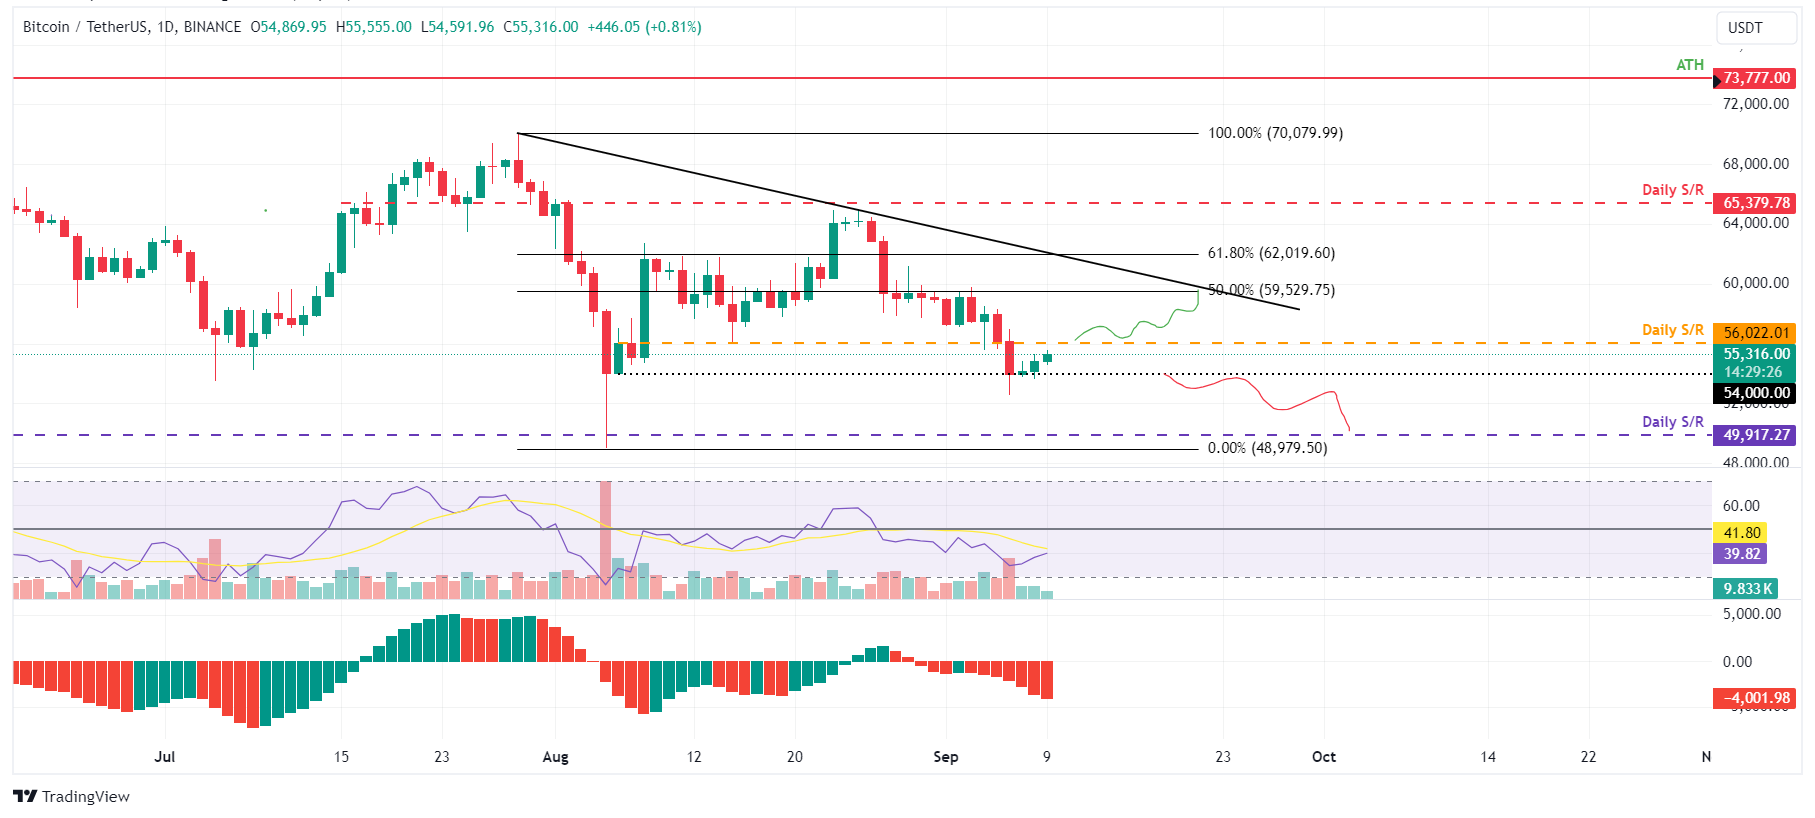
BTC/USDT daily chart
However, the bearish thesis will be invalidated if Bitcoin’s price breaks above the $56,022 resistance. In this scenario, BTC could extend the positive move by 6% to revisit its 50% price retracement level at $59,560.
Bitcoin, altcoins, stablecoins FAQs
Bitcoin is the largest cryptocurrency by market capitalization, a virtual currency designed to serve as money. This form of payment cannot be controlled by any one person, group, or entity, which eliminates the need for third-party participation during financial transactions.
Altcoins are any cryptocurrency apart from Bitcoin, but some also regard Ethereum as a non-altcoin because it is from these two cryptocurrencies that forking happens. If this is true, then Litecoin is the first altcoin, forked from the Bitcoin protocol and, therefore, an “improved” version of it.
Stablecoins are cryptocurrencies designed to have a stable price, with their value backed by a reserve of the asset it represents. To achieve this, the value of any one stablecoin is pegged to a commodity or financial instrument, such as the US Dollar (USD), with its supply regulated by an algorithm or demand. The main goal of stablecoins is to provide an on/off-ramp for investors willing to trade and invest in cryptocurrencies. Stablecoins also allow investors to store value since cryptocurrencies, in general, are subject to volatility.
Bitcoin dominance is the ratio of Bitcoin's market capitalization to the total market capitalization of all cryptocurrencies combined. It provides a clear picture of Bitcoin’s interest among investors. A high BTC dominance typically happens before and during a bull run, in which investors resort to investing in relatively stable and high market capitalization cryptocurrency like Bitcoin. A drop in BTC dominance usually means that investors are moving their capital and/or profits to altcoins in a quest for higher returns, which usually triggers an explosion of altcoin rallies.
Author

Manish Chhetri
FXStreet
Manish Chhetri is a crypto specialist with over four years of experience in the cryptocurrency industry.


