Bitcoin investors accumulate BTC amid Mt. Gox and German Government fund transfer FUD
- Bitcoin spot ETFs received the second consecutive day of inflows this week on Tuesday.
- On June 5 and 6, 35,486 BTC outflowed from BitMEX, marking the second-largest BTC outflow in the exchange.
- Despite FUD from Mt. Gox and the German government, on-chain data shows investors quietly accumulating BTC.
- Technical analysis shows that BTC has formed a bullish divergence on a momentum indicator.

Bitcoin (BTC) has encountered resistance near the $58,375 weekly level during the past few days, trying to break and hovering just above it at $58,865 at the time of writing on Wednesday. Concurrently, on-chain data reveals quiet BTC accumulation, alongside a notable outflow of 35,486 BTC from exchanges on June 5 and 6, marking BitMEX's second-largest outflow in history. In addition, Bitcoin spot ETFs received $216.4 million in inflows on Tuesday, marking the second consecutive day of positive netflows this week. Technical analysis also indicates a bullish divergence on a momentum indicator, suggesting a potential rally ahead.
Daily digest market movers: Bitcoin has recorded the second-largest Bitcoin outflow in BitMEX history
- According to on-chain market intelligence and analytics platform CryptoQuant, Bitcoin Exchange Netflow data from BitMEX has recorded the second-largest Bitcoin outflow in history. Historically, the Exchange Netflow indicator on BitMEX has shown a strong inverse correlation with Bitcoin price movements.
- When this indicator turns highly negative, indicating significant BTC outflows from exchanges, Bitcoin's price rises. Large BTC outflows from BitMEX suggest that major investors withdraw their holdings, possibly for cold storage or strategic sales on other platforms. This behavior reduces immediate selling pressure on the exchange, stabilizing or potentially increasing Bitcoin's price.
- Recently, an outflow of 35,486 BTC occurred, marking the second-largest BTC outflow in BitMEX's history.
%20-%20BitMEX-638562035442921959.png)
Bitcoin Exchange Netflow (Total) - BitMex chart
- On Tuesday, US spot Bitcoin ETFs recorded their second consecutive day of inflows this week of $216.4 million. This surge indicates increasing investor confidence, suggesting a potential short-term uptick in Bitcoin's price. Monitoring net inflow data from these ETFs is vital for assessing investor sentiment and comprehending market trends. Together, the 11 US spot Bitcoin ETFs presently hold reserves amounting to $49.14 billion in Bitcoin.
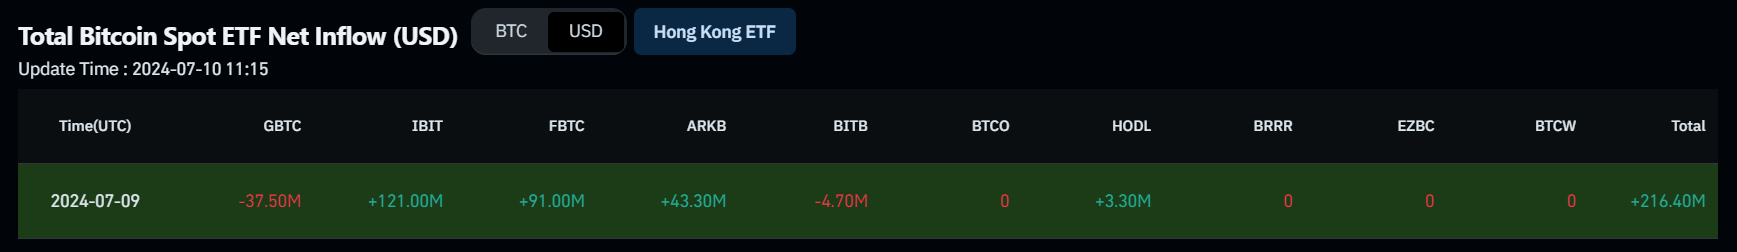
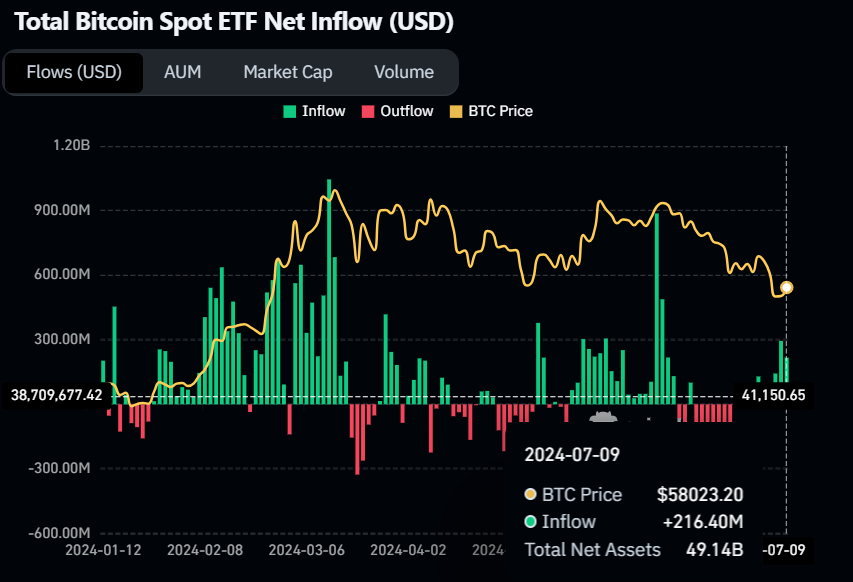
Bitcoin Spot ETF Net Inflow chart
- Additionally, data from CryptoQuant reveals that amid the FUD (Fear, Uncertainty, Doubt) triggered by Mt. Gox's and the German government's fund transfers on exchanges over the past weeks, certain investors are discreetly accumulating BTC, as shown in the chart below.
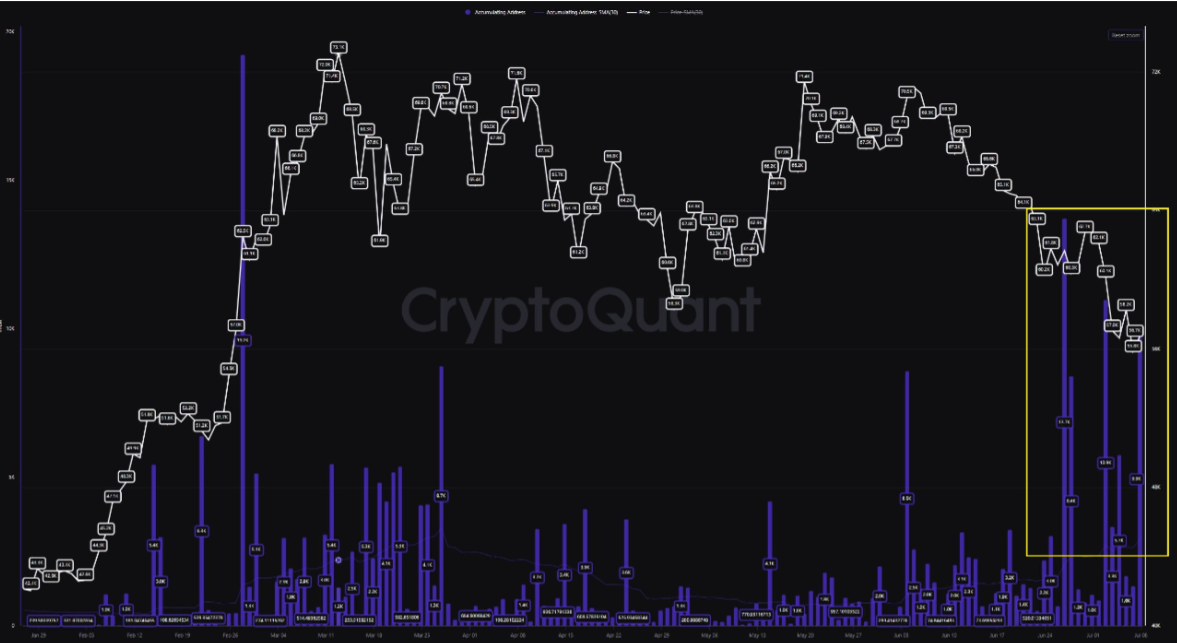
Bitcoin Accumulation chart
- Coinglass Bitcoin Long/Short Ratio provides insight into market sentiment among traders and investors regarding Bitcoin's price direction. A high long/short ratio typically suggests bullish sentiment, indicating that more traders are betting on increasing Bitcoin's price. Conversely, a low ratio may indicate bearish sentiment, suggesting more traders expect Bitcoin's price to decrease.
- In BTC's case, the long-to-short ratio was 1.081, meaning there are 1.081 times as many long positions as short positions, further bolstering BTC's bullish outlook.
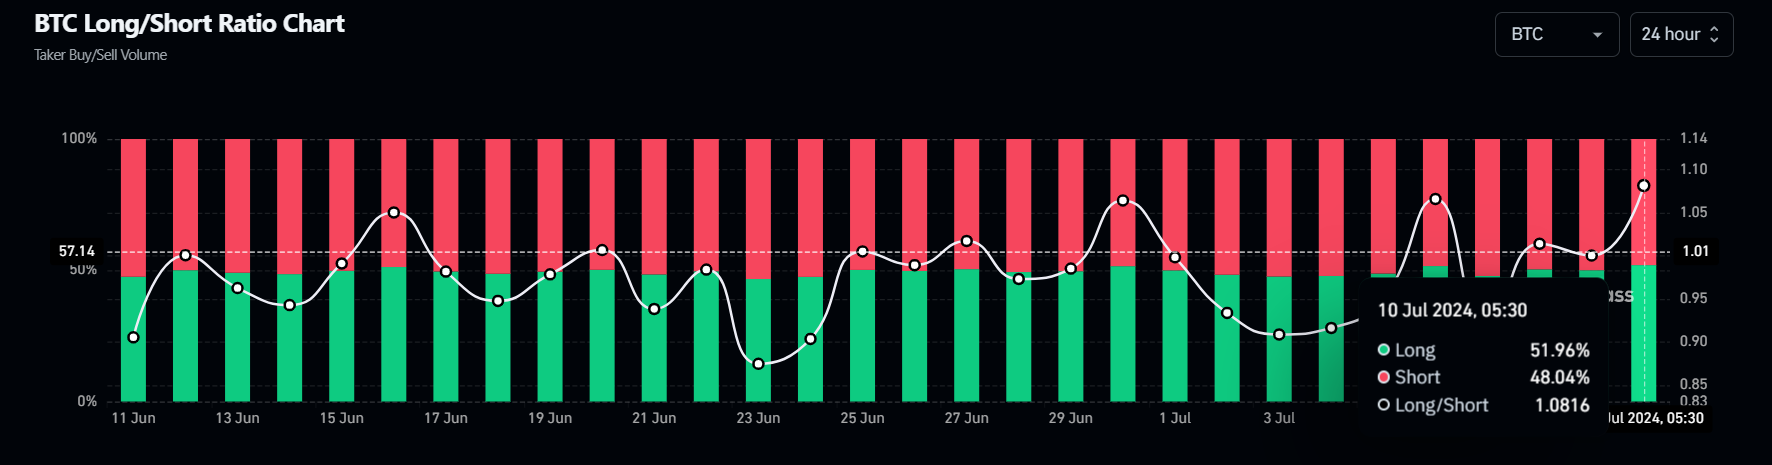
Bitcoin Long/Short Ratio chart
Technical analysis: BTC momentum indicators show bullish divergence
Bitcoin price has faced resistance near the weekly level of $58,375 over the last four days. BTC/USDT is testing that level and hovers just above $58,865, marking a 1.3% increase on Wednesday.
Additionally, the formation of a lower low in the daily chart on July 5 contrasts with the Relative Strength Index's (RSI) higher high during the same period. This development is termed a bullish divergence and often leads to the reversal of the trend or a short-term rally.
If BTC's daily candlestick closes above the $58,375 weekly resistance level, it could rise 9% to revisit the daily resistance at $63,956.
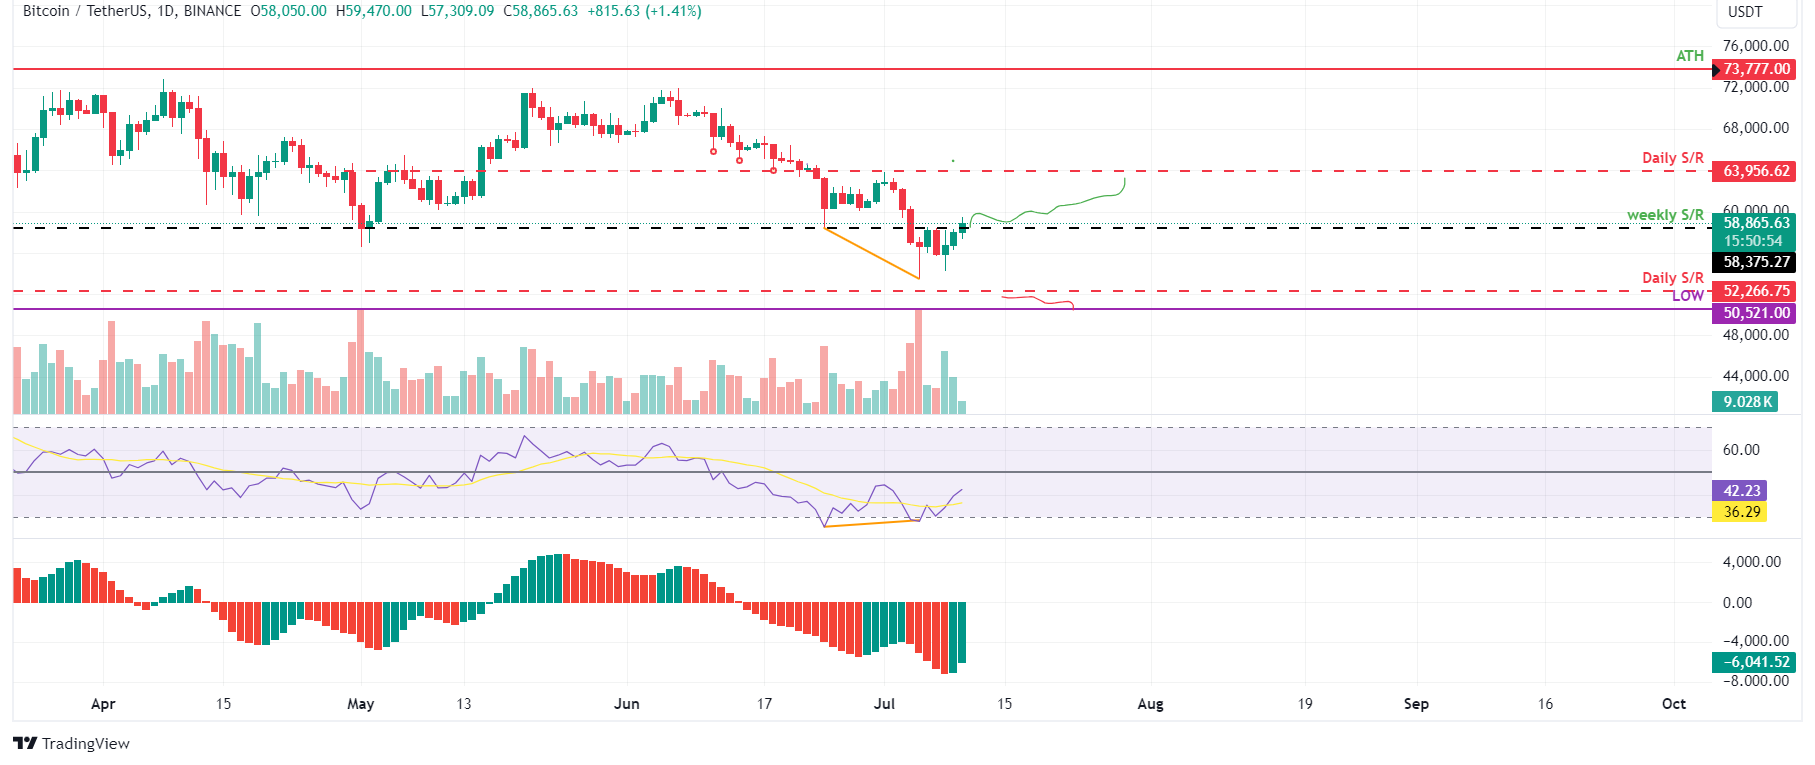
BTC/USDT daily chart
On the other hand, if BTC closes below the $52,266 daily support level and forms a lower low in the daily time frame, it could indicate that bearish sentiment persists. Such a development may trigger a 4% decline in Bitcoin's price to revisit its daily low of $50,521 from February 23.
Bitcoin, altcoins, stablecoins FAQs
Bitcoin is the largest cryptocurrency by market capitalization, a virtual currency designed to serve as money. This form of payment cannot be controlled by any one person, group, or entity, which eliminates the need for third-party participation during financial transactions.
Altcoins are any cryptocurrency apart from Bitcoin, but some also regard Ethereum as a non-altcoin because it is from these two cryptocurrencies that forking happens. If this is true, then Litecoin is the first altcoin, forked from the Bitcoin protocol and, therefore, an “improved” version of it.
Stablecoins are cryptocurrencies designed to have a stable price, with their value backed by a reserve of the asset it represents. To achieve this, the value of any one stablecoin is pegged to a commodity or financial instrument, such as the US Dollar (USD), with its supply regulated by an algorithm or demand. The main goal of stablecoins is to provide an on/off-ramp for investors willing to trade and invest in cryptocurrencies. Stablecoins also allow investors to store value since cryptocurrencies, in general, are subject to volatility.
Bitcoin dominance is the ratio of Bitcoin's market capitalization to the total market capitalization of all cryptocurrencies combined. It provides a clear picture of Bitcoin’s interest among investors. A high BTC dominance typically happens before and during a bull run, in which investors resort to investing in relatively stable and high market capitalization cryptocurrency like Bitcoin. A drop in BTC dominance usually means that investors are moving their capital and/or profits to altcoins in a quest for higher returns, which usually triggers an explosion of altcoin rallies.
Author

Manish Chhetri
FXStreet
Manish Chhetri is a crypto specialist with over four years of experience in the cryptocurrency industry.


