Bitcoin Price Analysis: BTC/USD bulls smash out of flag structure
- Bitcoin price is trading in positive territory, up 1.55% in the second half of the session.
- BTC/USD bulls have managed to regain control following a breakout from a flag structure.
- The price has broken back above the barrier of resistance seen at $8500.

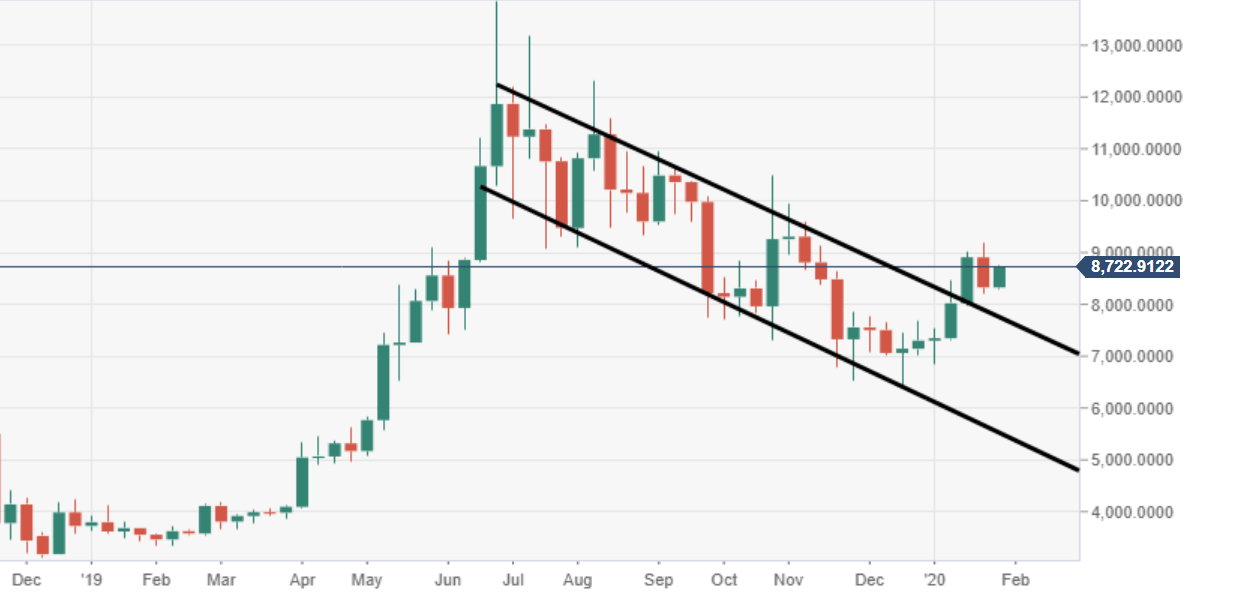
BTC/USD weekly chart
The price closed the latest week in the red, following a decent five straight week run higher. Momentum has resumed the upside pressure, with eyes on weekly resistance at the psychological $9000 mark. Further moves higher still eyed following bull flag breakout.
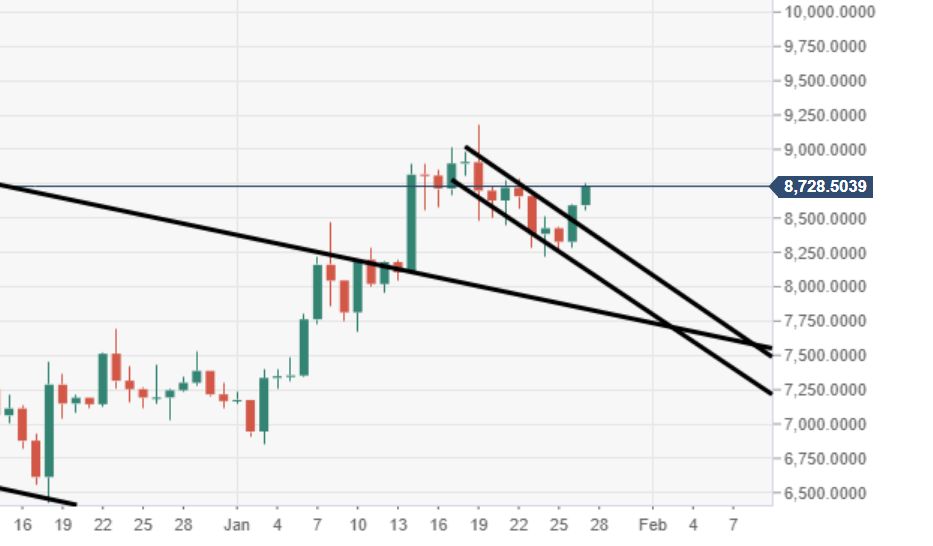
BTC/USD daily chart
Price action has broken out to the upside from a bullish flag structure, making way for further momentum to the north.
Spot rate: 8725.61
Relative change: +1.55%
High: 8758.11
Low: 8557.73
Author

Ken Chigbo
Independent Analyst
Ken has over 8 years exposure to the financial markets. He started his career as an analyst, covering a variety of asset classes; forex, fixed income, commodities and equities.
More from Ken Chigbo


