Bitcoin nears major low as Elliott Wave count and momentum divergences point to reversal potential

In our April update, we found, using the Elliott Wave Principle (EWP), that Bitcoin (BTC) would ideally rally to $82,612- $84,339 before another decline. BTC topped at $82,813 on May 6 and hit a new low at $57,739 today. So far, so good; see Figure 1 below.
The recent decline is best counted as a five-wave structure (gray waves i, ii, iii, iv, v), with the final 5th wave subdividing into five smaller (blue) waves. The last fifth of a fifth of a fifth wave could have completed today -- blue Wave-v (W-v) of orange W-5 of gray W-v of green W-c of red W-iv -- illustrating the fractal nature of financial markets.
Figure 1: short-term Elliott Wave count for BTC with several technical indicators
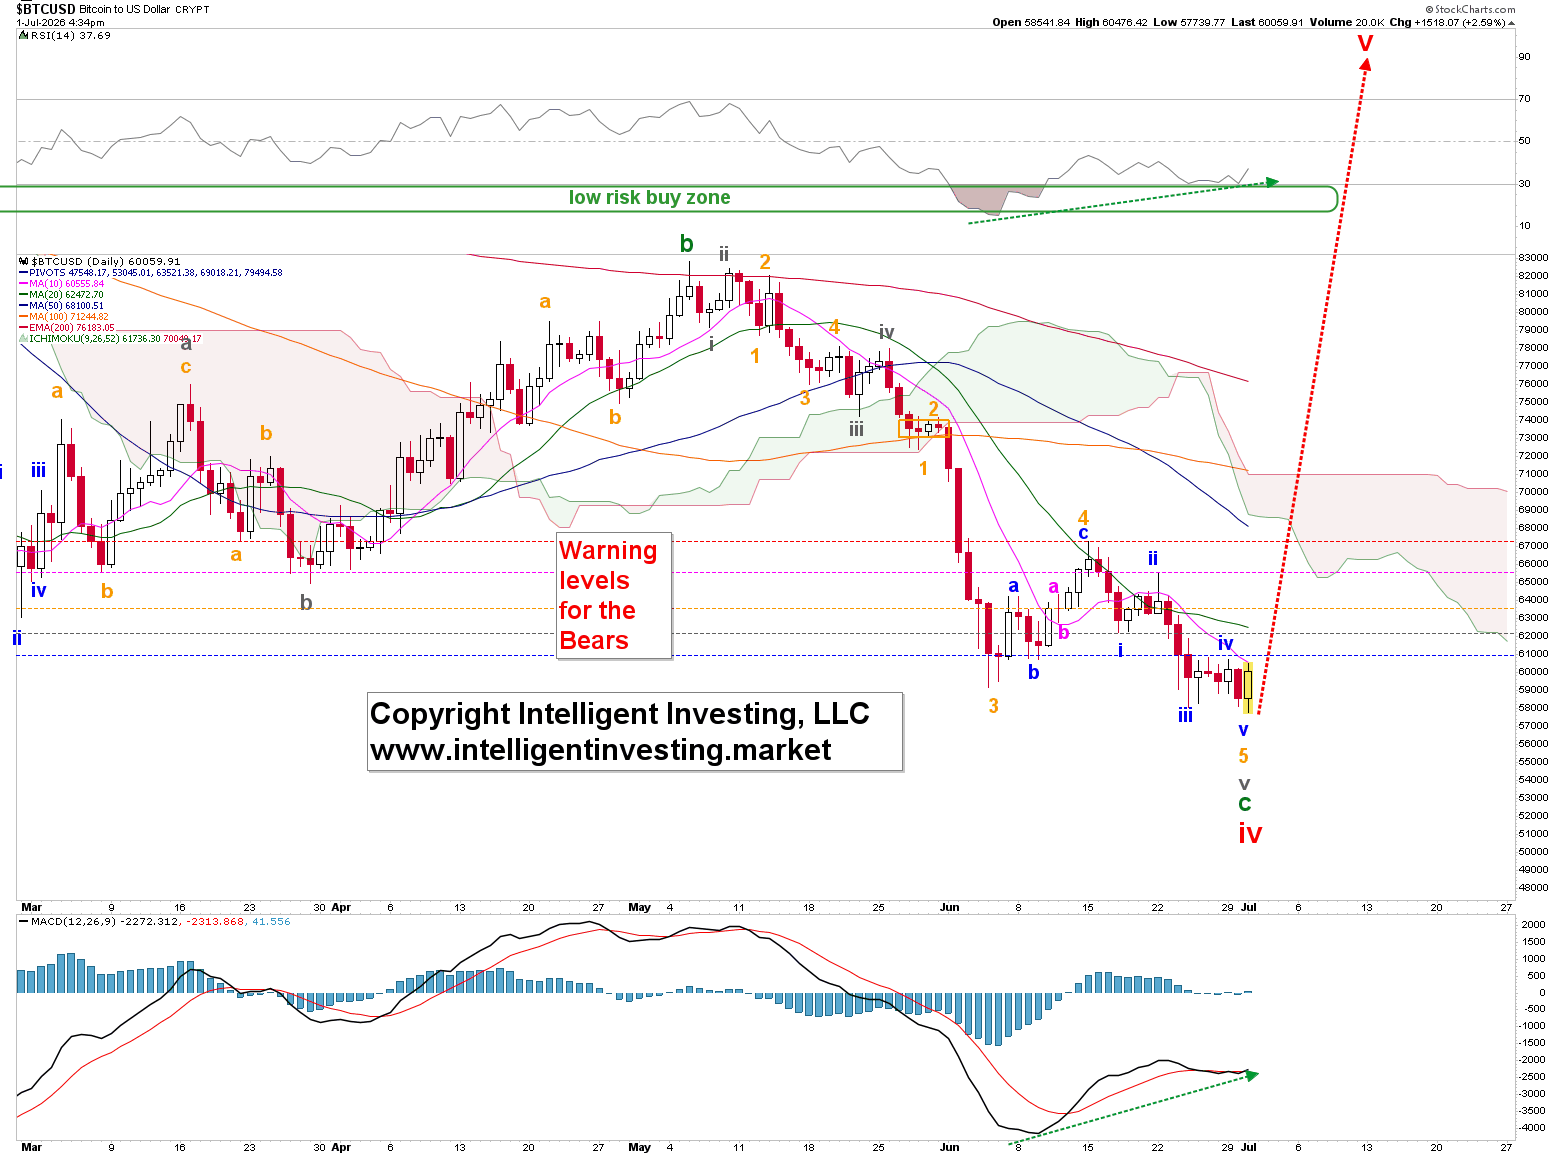
Besides, positive divergences are forming on the daily MACD and RSI5 (green dotted arrows). This is typical at the terminal, i.e., in the 5th wave, as in this case, the downside is losing momentum and strength. Now price needs to confirm this thesis by ultimately breaking back above the orange W-4 high, which peaked on June 15 at $67,256, with a serious warning for the Bears on a move above $65,555. That is the blue W-ii high made on June 22.
Zooming out, using the monthly time frame, see Figure 2 below, we find that
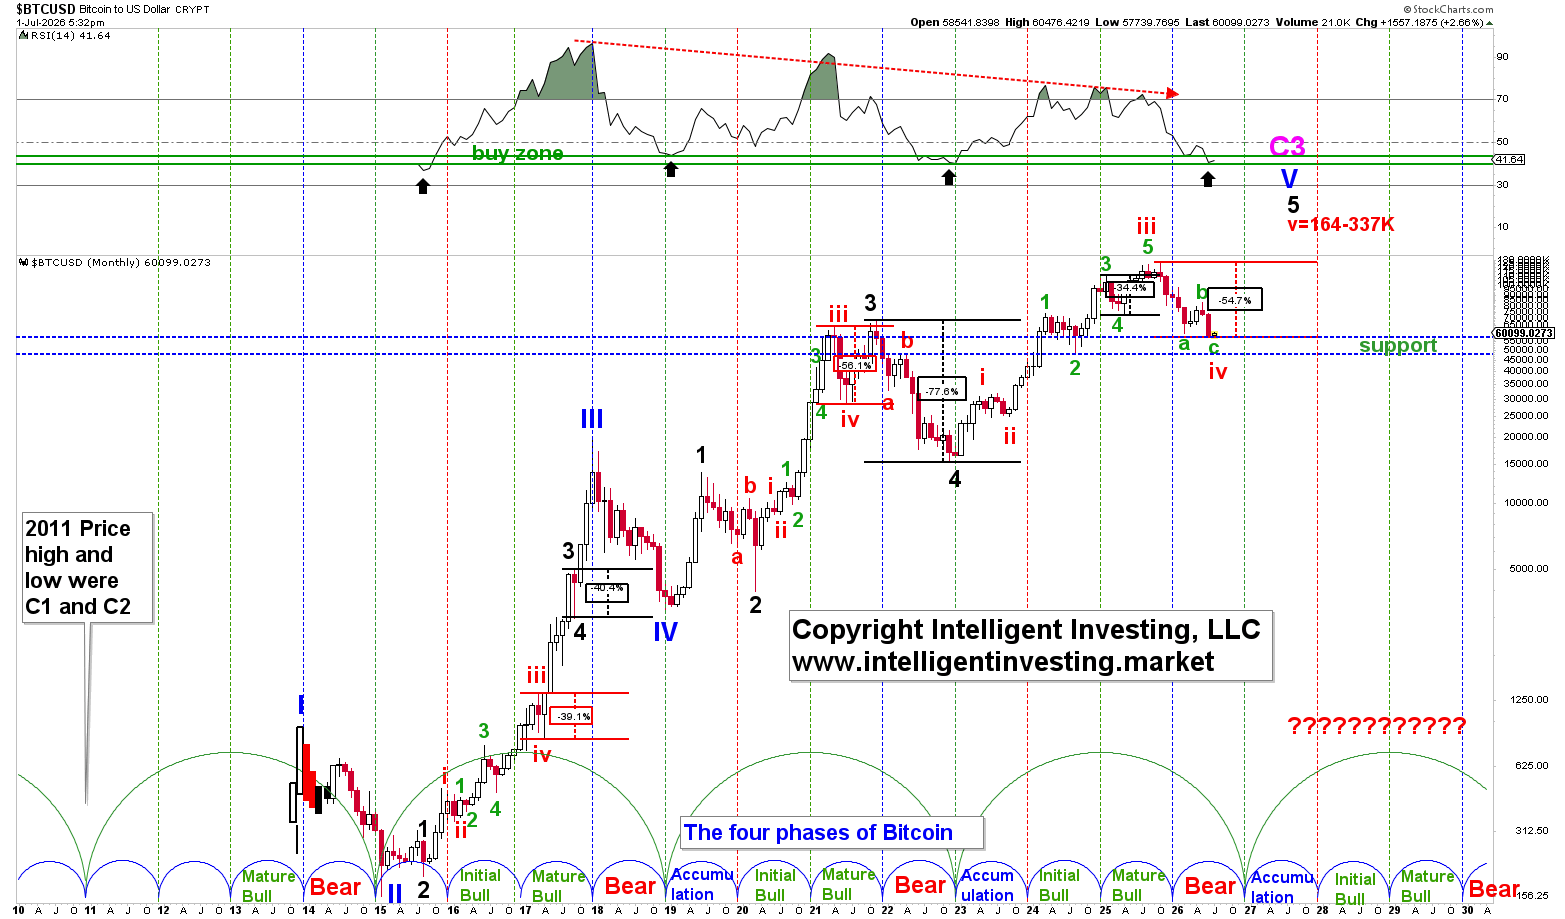
A) BTC has so far done three larger waves lower from its ATH to today’s low (green W-a, b, c), and all corrections comprise at least three waves.
B) BTC’s price sits right at support ($49,200-$58,870)
C) The monthly RSI is in the “low risk buy zone” (as is the daily, btw), which historically signaled important lows were imminent (2022, 2019, 2015): black up arrows.
D) BTC’s price underwent a ~56% haircut, which historically is not unusual, as previous fourth waves ranged from -34% to -77%, with an average of -49%
E) Assuming the 4-year cycle of BTC continues, its ~12-month-long bear market (December 2025-December 2026) is near its end, especially considering the top was about two months earlier (October 13, 2025)
Figure 2. Long-term Elliott Wave count for BTC with several technical indicators
Thus, since we cannot know whether the 4-year cycles continue to play out, we should use it as one of many reference points. The cycles are not precisely 4 years long and have varied in length over time, often missing the exact marks by a few months. As such, we must incorporate additional reference points, such as the EWP and technical indicators, into our trading and investment decisions. Because it’s the weight of the evidence that provides for the most likely outcome, not the belief in one aspect over another.
Thus, in this update, we show that the weight of the evidence points to the formation of an important low. While we don’t have confirmation yet, as BTC hasn’t yet made higher highs and higher lows, the current setups are promising. For those who remember, we turned Bullish on Bitcoin in April 2023, just three months after it bottomed in late 2022. It traded around $29,000 and rose to $126,000+ over the next 2.5 years.
Author

Dr. Arnout Ter Schure
Intelligent Investing, LLC
After having worked for over ten years within the field of energy and the environment, Dr.


