Bitcoin entering wave 4 consolidation in strong uptrend
-
Bitcoin (BTC/USD) made a bullish breakout last week which reached the expected target at $57.5k.
-
Bitcoin has made a bullish bounce at the 38.2% Fibonacci retracement support level. Although the bearish decline was fierce, the bulls were able to stop and reverse it.
-
The resistance trend line (orange) will not be an easy level to break. But if price action does break it, then a bullish wave C (green) is expected.

However, the bearish retracement has been much more impulsive than previous pullbacks in the current uptrend.
Let’s review the status of the uptrend in combination with the chart plus wave patterns.
Price charts and technical analysis
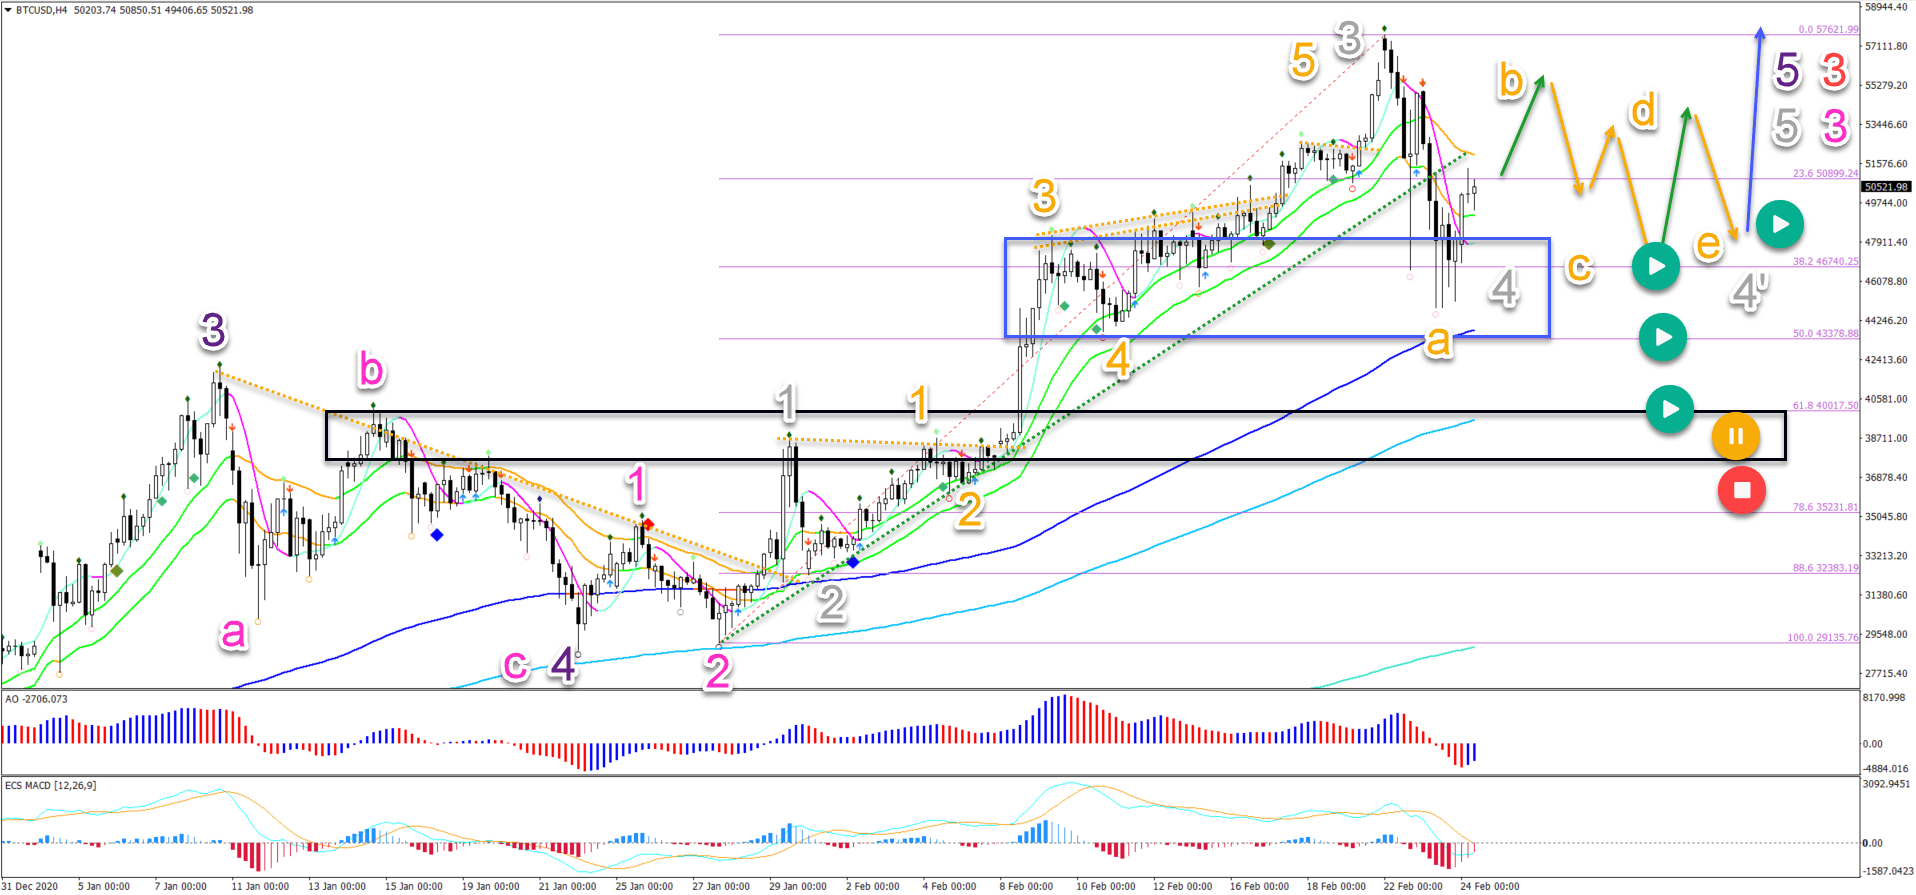
The BTC/USD bearish retracement seems to be similar to the ETH/USD pullback in yesterday’s analysis: a wave 4 pattern (grey).
Just like Ethereum, Bitcoin has made a bullish bounce at the 38.2% Fibonacci retracement support level (blue box). Although the bearish decline was fierce, the bulls were able to stop and reverse it.
The strong decline is typical for a wave A of a larger ABCDE triangle pattern (orange). Which is why a triangle has the best probability at the moment. Let’s review the daily chart above:
-
A push up should retest the previous top (wave B orange).
-
A bearish bounce the previous top could confirm the wave B (orange).
-
ABC patterns and a lower high and higher low should confirm the larger ABCDE movement (orange and green arrows).
-
Once the ABCDE triangle pattern is completed, an uptrend continuation is expected to push price action higher towards $65k and $75k.
-
A bearish break below the 38.2% Fib invalidates the ABCDE triangle but price action is still expected to find support at the 50-61.8% Fibonacci levels.
-
Only a break below the next support zone (black box) would invalidate the current wave analysis (red circle) and indicate a deeper retracement.
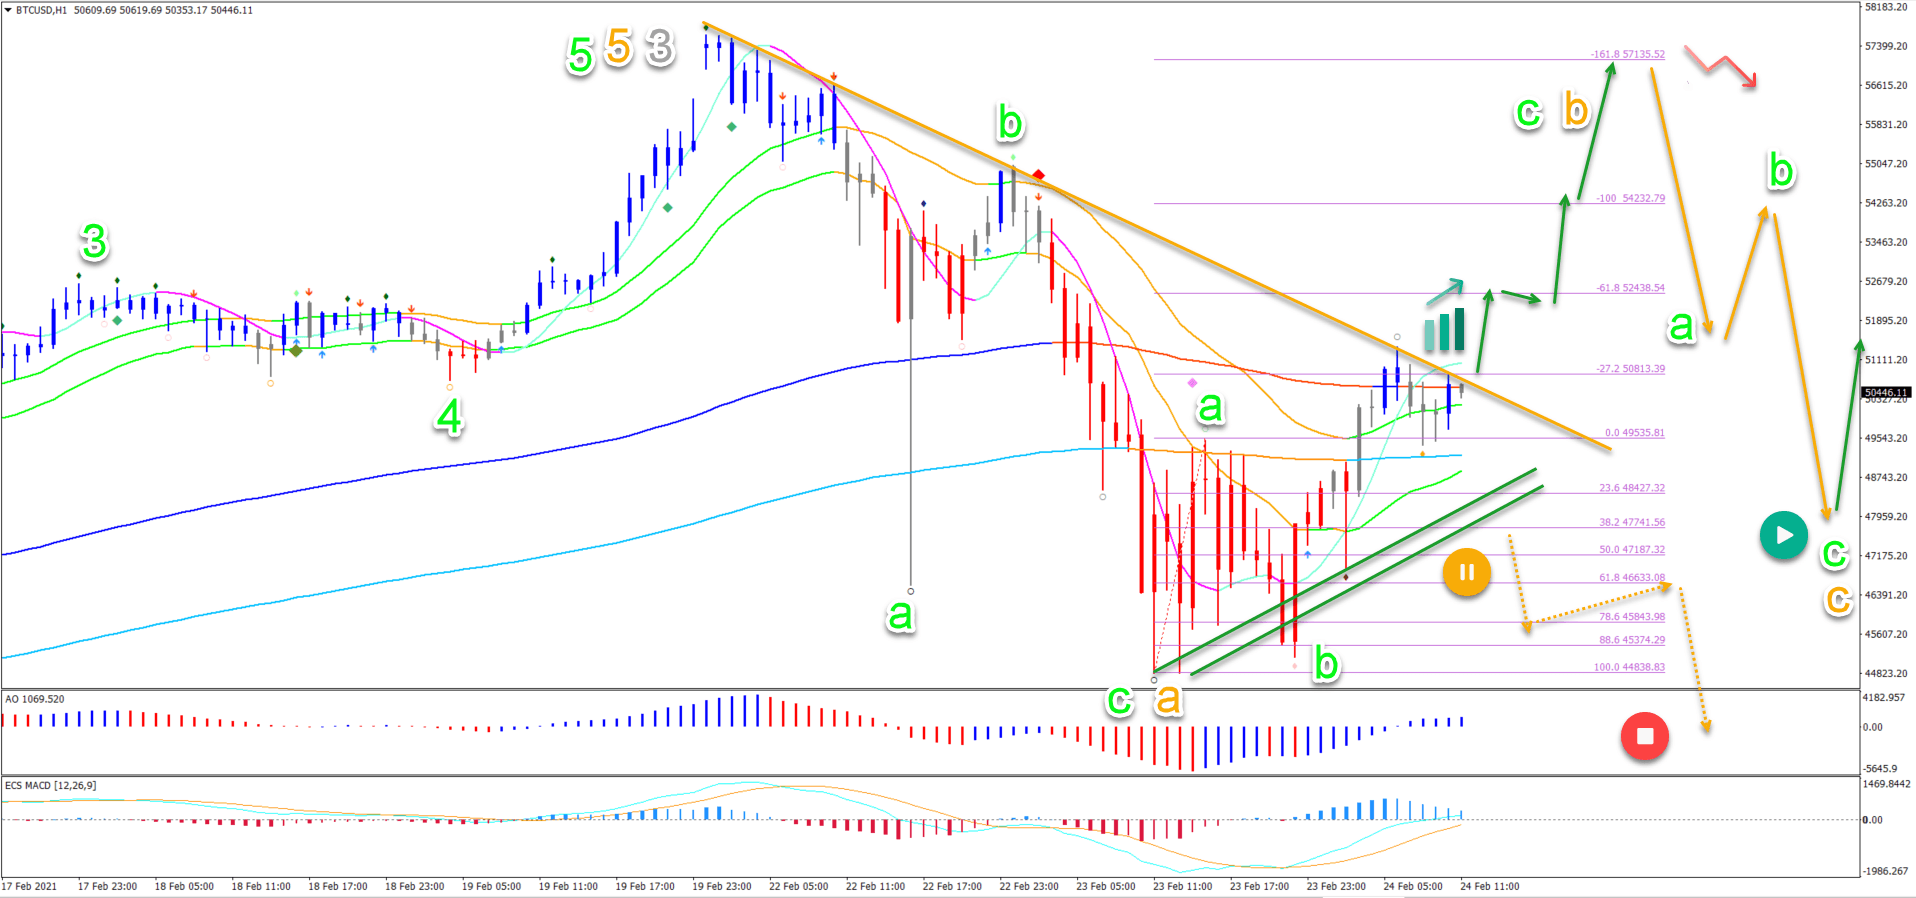
On the 1 hour chart, the bearish price action yesterday was an ABC (green) correction in the wave A (orange).
The resistance trend line (orange) will not be an easy level to break. But if price action does break it, then a bullish wave C (green) is expected.
The main target for the immediate breakout is the previous top. Here a bearish bounce is likely (red arrow), which could create a wave C (orange) downwards (orange arrows).
Only an immediate bearish breakout below the support lines (green) could indicate more downside pressure (dotted orange arrows) sooner than expected. In that case, price action could reach the next support zone at $40k-$44k.
The analysis has been done with the ecs.SWAT method and ebook.
Author

Chris Svorcik
FS method
Chris Svorcik is a trader, analyst, and educator with over 15 years of experience in financial markets, specializing in moving averages, market structure, and price patterns.




