Bitcoin Elliott Wave technical analysis [Video]
![Bitcoin Elliott Wave technical analysis [Video]](https://editorial.fxstreet.com/images/Markets/Currencies/Cryptocurrencies/Coins/Bitcoin/bitcoin.jpg)
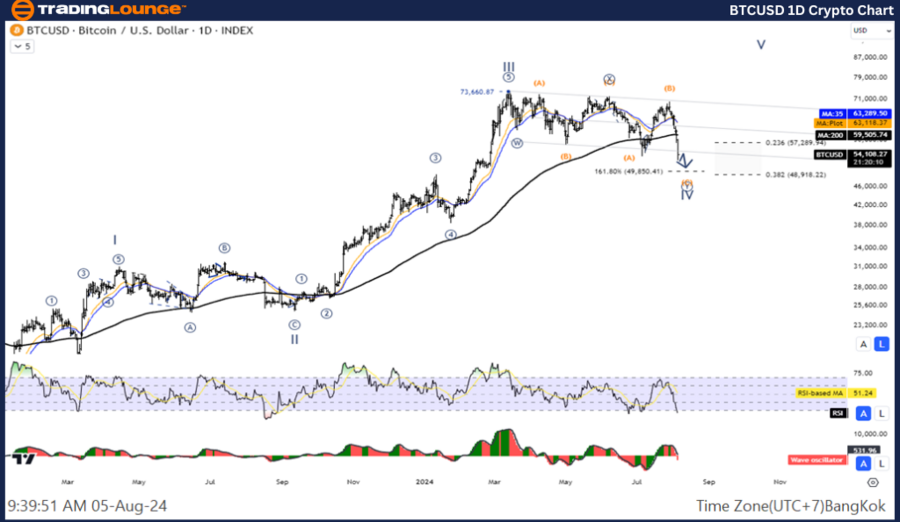
BTC/USD Elliott Wave technical analysis
Function: Counter Trend.
Mode: Corrective.
Structure: Double Corrective.
Position: Wave ((Y)).
Direction next higher degrees: Wave IV.
Details: The decline in wave IV before increase again in Wave V.
Bitcoin / U.S. dollar (BTCUSD) trading strategy: It seems that the fourth wave correction is not complete and the price is still likely to drop to test the 48,918 level. Therefore, wait for the correction to complete to look for an opportunity to rejoin the trend in the fifth wave.
Bitcoin / U.S. dollar (BTCUSD) Technical Indicators: The price is blow the MA200 indicating a Downtrend, The Wave Oscillator is a Bearish Momentum.
BTC/USD one-day chart
BTC/USD Elliott Wave technical analysis
Function: Counter Trend.
Mode: Corrective.
Structure: Double Corrective.
Position: Wave ((Y)).
Direction next higher degrees: Wave IV.
Details: The decline in wave IV before increase again in Wave V.
Bitcoin / U.S. dollar (BTCUSD) trading strategy: It seems that the fourth wave correction is not complete and the price is still likely to drop to test the 48,918 level. Therefore, wait for the correction to complete to look for an opportunity to rejoin the trend in the fifth wave.
Bitcoin / U.S. dollar(BTCUSD)Technical Indicators: The price is blow the MA200 indicating a Downtrend, The Wave Oscillator is a Bearish Momentum.
BTC/USD four-hour chart
.png.b55f34964bbd7aa0512cff94694b8e86.png)
Bitcoin Elliott Wave technical analysis [Video]
Author

Peter Mathers
TradingLounge
Peter Mathers started actively trading in 1982. He began his career at Hoei and Shoin, a Japanese futures trading company.


