Bitcoin Elliot Wave outlook: Bullish momentum builds

In our March update, when Bitcoin was trading around $68,750, we noted that the Elliott Wave pattern indicated “an important low has already been struck or will be soon.” In the former case, the Bulls “had to A) always keep the price above the February 6 low of $60,069. And B), … push Bitcoin’s price above … $72,226 to allow the gray Wave-iii/c to unfold to $82,314.” See Figure 1 below.
Fast forward to today: $60,069 held, and Bitcoin is now well above $72,226, having broken above it several times before, but those attempts failed to hold. Regardless, a large leading expanding diagonal (LED), a 3-3-3-3-3 (abc-abc-abc-abc-abc) advance, remains our preferred POV until proven otherwise, as we already identified it for our premium members on March 20th and have been tracking its advance since. Note that LEDs are very rare price patterns, often mistaken for corrective bounces because they overlap so much.
Figure 1. Short-term Elliott Wave Count for Bitcoin
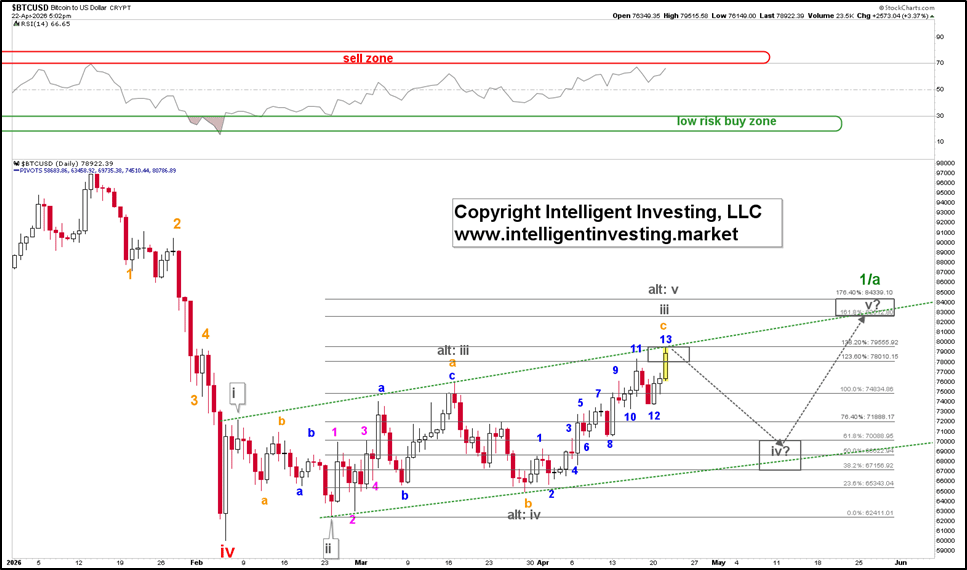
Namely, in LEDs, the 3rd wave typically ranges from 123.60% to 138.2%, the 4th wave from 38.2% to 61.8%, and the 5th wave from 161.80% to 200.00%. Additionally, the 5th wave is the longest, the 3rd wave is the second longest, and the 1st wave is the shortest. Thus, at this stage, there are enough waves in place to consider the green W-1/a as complete, labeled as the gray “alt: iii, iv, v” sequence. However, a more pronounced gray W-iv pullback, as shown using the gray arrows, would look even better. Regardless, once W-1/a completes, expect a significant pullback to the start of the LED at around $65,000 +/- 1,000.
Moreover, Bitcoin’s price has moved back above its 10-day, 20-day, 50-day, and 100-day Simple Moving Averages (SMA), as well as its Ichimoku cloud. Additionally, its price has broken above the persistent downtrend line that had capped its upside since last October (red dotted line). See Figure 2 below. These breakouts provide further confirmation of a strengthening bullish trend and increase confidence in the ongoing upward movement.
Figure 2. Bitcoin’s price chart with several key indicators and a downtrend line
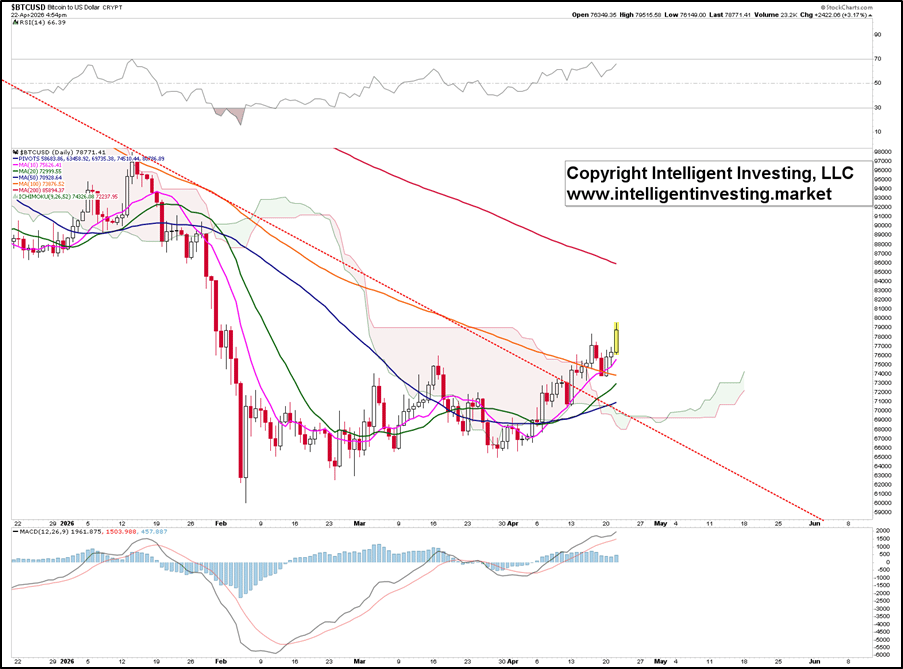
Final resistance is at the 200-day SMA, which is now at $85894 and declines by about $230 per day. The 200-day SMA will thus reach the 176.4-200.00% target zone in less than a month. Lastly, the MACD and RSI14 are pointing up, which is also Bullish.
Author

Dr. Arnout Ter Schure
Intelligent Investing, LLC
After having worked for over ten years within the field of energy and the environment, Dr.


