Avalanche Price Forecast: AVAX extends rally as bullish momentum builds
- Avalanche is up 5% above its 50-day EMA on Monday, extending gains from last week.
- The rise in AVAX futures Open Interest despite increased liquidations over the last 24 hours suggests a near-term bullish narrative.
- Avalanche could advance further, as the steady rise in RSI and MACD indicates heightened bullish pressure.

Avalanche (AVAX) trades in the green above $10 at press time on Monday, building on the roughly 13% gains from last week. The Layer-1 blockchain token regains retail demand as the broader cryptocurrency market shows early signs of recovery, despite the escalating US-Iran war.
Derivatives data reveals bullish retail sentiment
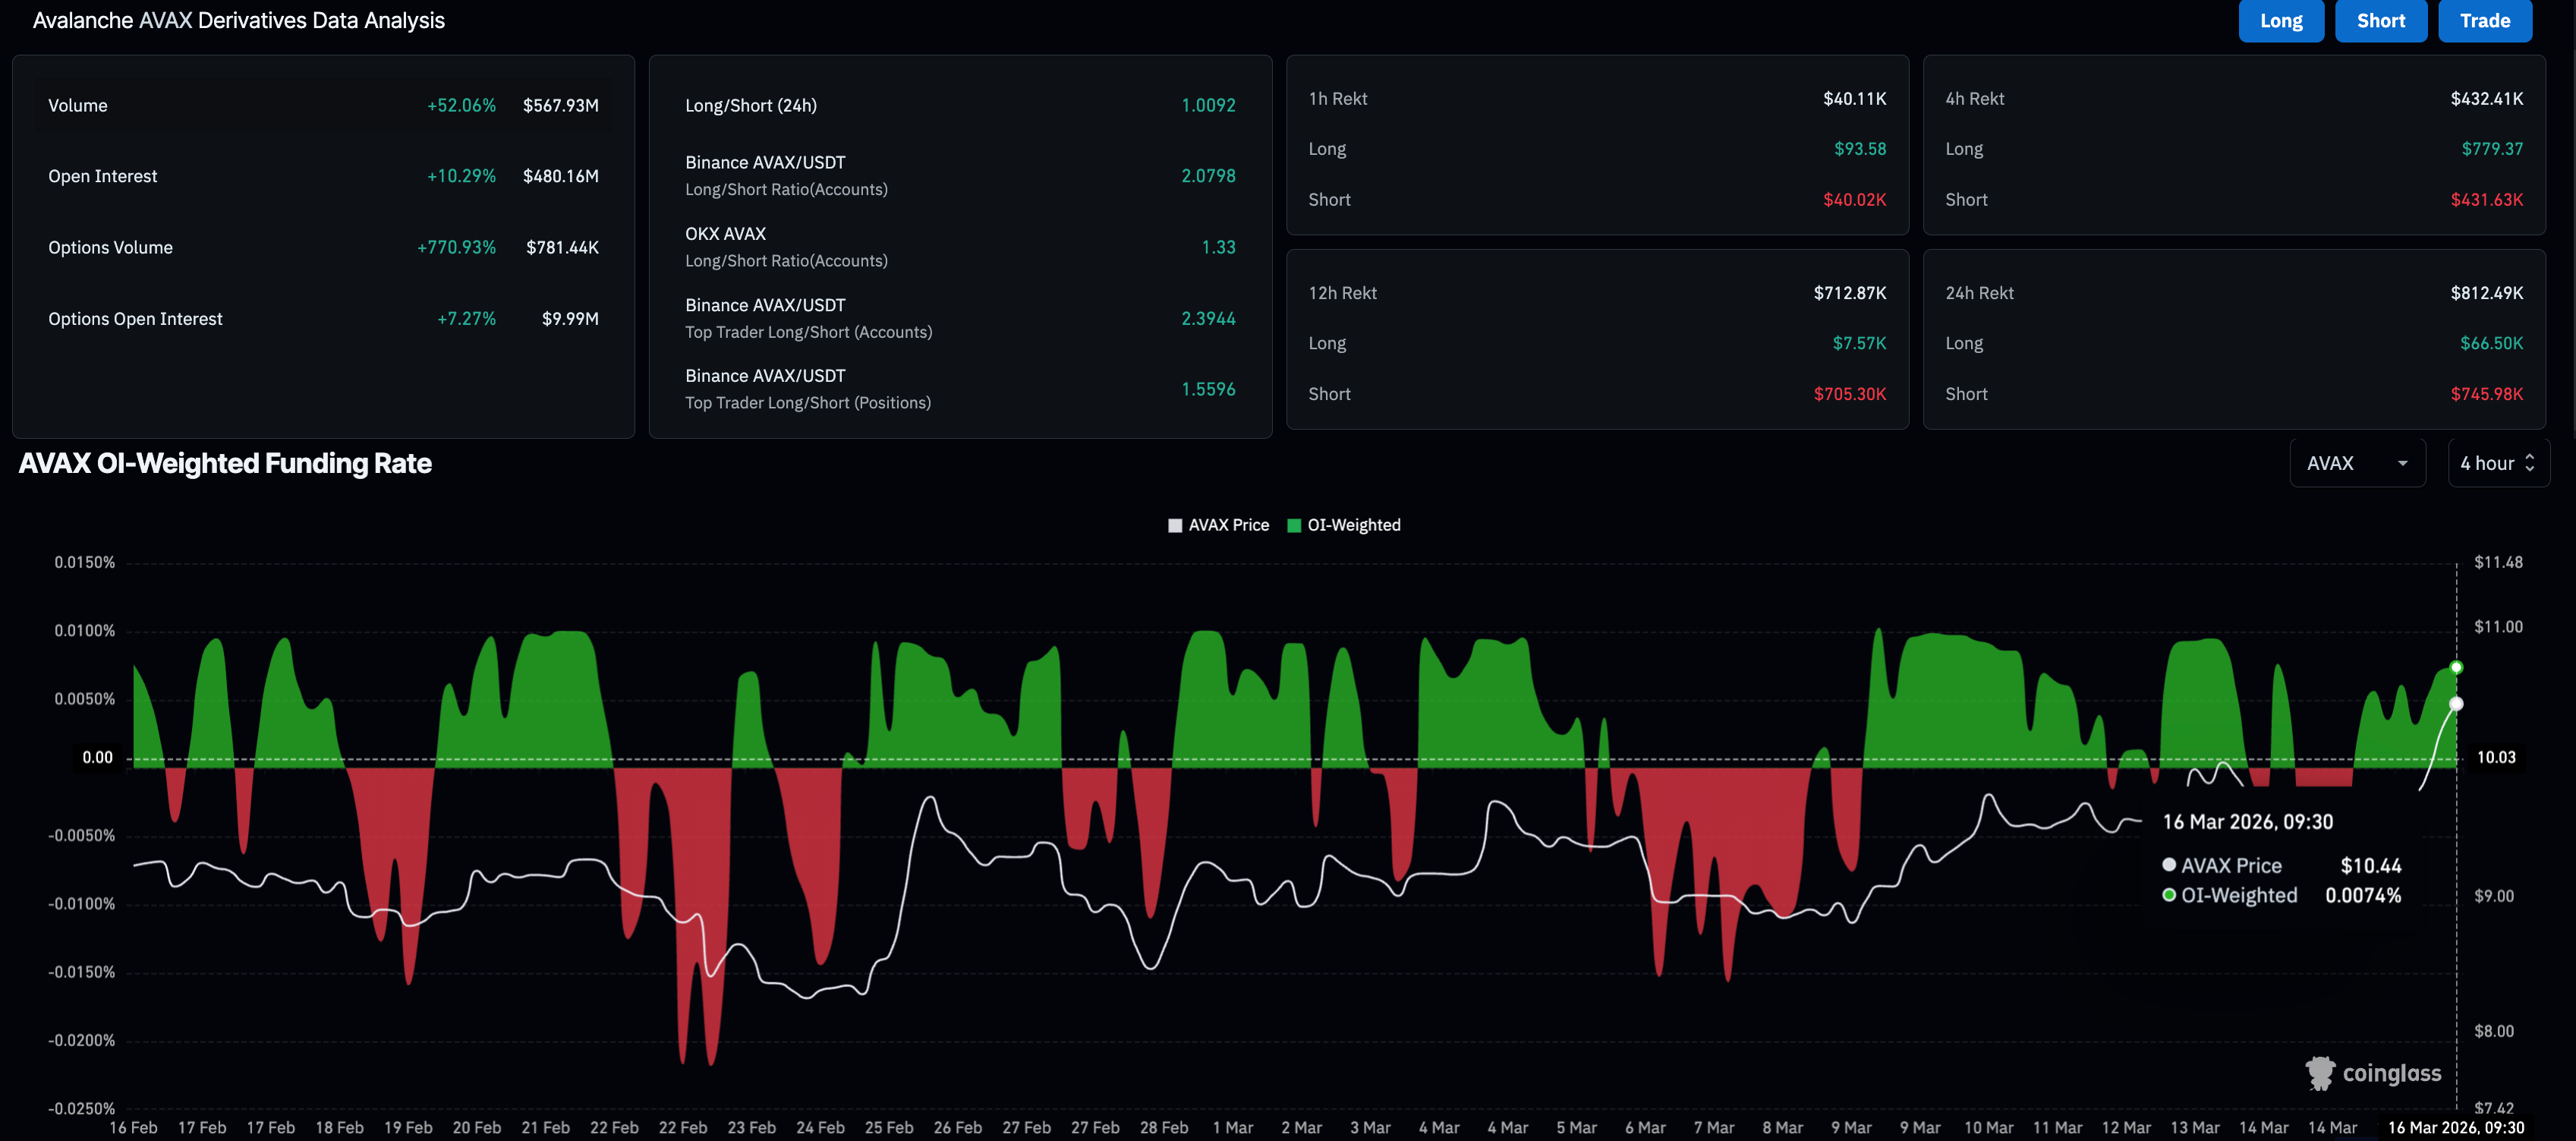
Avalanche gains retail strength during Asian trading hours on Monday, backing the ongoing recovery run. CoinGlass data shows a 10% increase in AVAX Open Interest (OI) to $480.16 million in the last 24 hours, suggesting a renewed risk-on sentiment among traders, willing to build AVAX futures positions.
The AVAX OI-weighted funding rate is at 0.0074%, signaling a bullish incline in the rebuilt positions as traders are willing to hold long positions at a premium. Consistent with the bullish bias, short liquidations of $745,980 over the last 24 hours outpace long liquidations of $66,500 in the same period, indicating a forced wipeout of bearish traders.
AVAX’s trendline breakout rally gains traction
Avalanche is up 5% at press time on Monday, continuing with the 2% gains from the previous day. The recovery run extends rally after breaking above the descending resistance trend line that capped advances throughout the broader decline. The near-term bias is bullish as AVAX trades above the SuperTrend line, near the 50-day Exponential Moving Average (EMA) at $9.96, while the descending 100-day and 200-day EMAs frame the move as an emerging recovery within a still-broader downtrend.
If AVAX holds a daily close above $9.96, it would confirm the 50-day EMA breakout and target the upper resistance cluster of the December 18 low at $11.28 and the 100-day EMA at $11.62.
Momentum supports the upside bias, with the Relative Strength Index (RSI) at 65 inching closer to the overbought zone and the Moving Average Convergence Divergence (MACD) line advancing above its signal line with green histogram bars expanding, both suggesting strengthening buying pressure.
If AVAX fails to hold above $9.96, it would test the durability of the descending trendline's breakout near $9.50. Below that, secondary support is seen at the $8.24 support floor, last tested on February 25.
(The technical analysis of this story was written with the help of an AI tool.)
Author

Vishal Dixit
FXStreet
Vishal Dixit holds a B.Sc. in Chemistry from Wilson College but found his true calling in the world of crypto.



