AAVE/USD Elliott Wave technical analysis [Video]
![AAVE/USD Elliott Wave technical analysis [Video]](https://editorial.fxstreet.com/images/Markets/Currencies/Cryptocurrencies/cryptocurrencies.jpg)
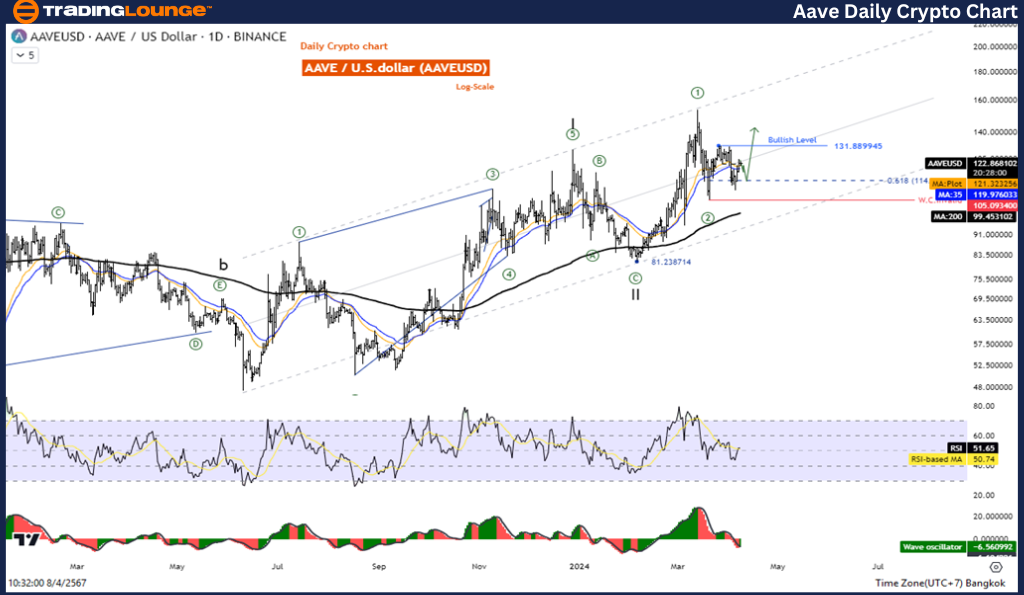
AAVE/USD Elliott Wave technical analysis
Function: Counter Trend.
Mode: Corrective.
Structure: Zigzag.
Position: Wave C.
Direction next higher degrees: Wave ((2)) of Impulse.
Wave cancel invalid level: 81.238.
Details: Wave ((2)) maybe is complete and the price increase in wave ((3)).
AAVE/USD trading strategy: Overall AAVE is moving in an uptrend with the Impulse pattern entering its third wave. We are currently recovering in the short term from the second wave correction. And the price will rise again during the third wave. Consider the opportunity for bullish trading. AAVE/ U.S. dollar(AAVEUSD)
Technical indicators: The price is above the MA200 indicating an Uptrend, Wave Oscillator is a bullish Momentum.
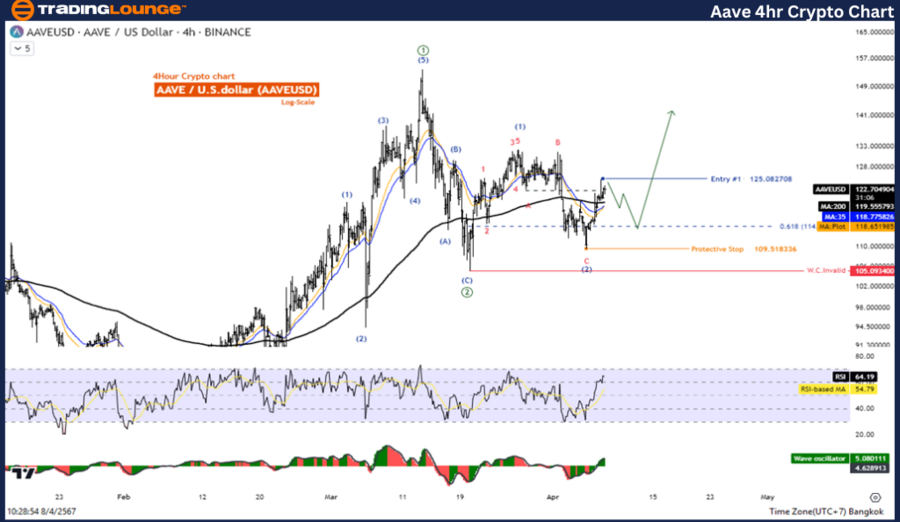
AAVE/USD Elliott Wave analysis four-hour chart
Function: Counter Trend.
Mode: Corrective.
Structure: Zigzag.
Position: Wave C.
Direction Next higher Degrees: Wave ((2)) of Impulse.
Wave Cancel invalid Level: 81.238.
Details: Wave ((2)) maybe is complete and the price increase in wave ((3)).
AAVE/USD trading strategy: Overall AAVE is moving in an uptrend with the Impulse pattern entering its third wave. We are currently recovering in the short term from the second wave correction. And the price will rise again during the third wave. Consider the opportunity for bullish trading. AAVE/ U.S. dollar(AAVEUSD).
Technical indicators: The price is above the MA200 indicating an Uptrend, Wave Oscillator is a bullish Momentum.
AAVE/USD Elliott Wave technical analysis [Video]
Author

Peter Mathers
TradingLounge
Peter Mathers started actively trading in 1982. He began his career at Hoei and Shoin, a Japanese futures trading company.


