GBP/USD Forecast: Pound Sterling could test 1.2100 next
- GBP/USD lost its traction after recovering toward 1.2200 early Wednesday.
- The near-term technical outlook points to a build-up of bearish pressure.
- Key support for the pair is located at 1.2100.

Following Tuesday's sharp drop, GBP/USD edged higher toward 1.2200 early Wednesday. The cautious market mood, however, didn't allow the pair to extend its rebound.
The data from the US revealed on Tuesday that the business activity in the private sector expanded at a slightly stronger pace in early October than in September, with the S&P Global Composite PMI improving to 51 from 50.2. Although US Treasury bond yields continued to push lower, the US Dollar (USD) benefited from the upbeat PMI reading and forced GBP/USD to stay on the back foot.
Pound Sterling price this week
The table below shows the percentage change of Pound Sterling (GBP) against listed major currencies this week. Pound Sterling was the weakest against the Australian Dollar.
| USD | EUR | GBP | CAD | AUD | JPY | NZD | CHF | |
| USD | -0.02% | 0.16% | 0.36% | -0.63% | 0.01% | -0.29% | 0.09% | |
| EUR | 0.01% | 0.17% | 0.36% | -0.62% | 0.01% | -0.29% | 0.10% | |
| GBP | -0.16% | -0.19% | 0.19% | -0.81% | -0.15% | -0.48% | -0.06% | |
| CAD | -0.37% | -0.38% | -0.22% | -0.99% | -0.35% | -0.65% | -0.24% | |
| AUD | 0.63% | 0.63% | 0.82% | 0.98% | 0.64% | 0.33% | 0.77% | |
| JPY | -0.01% | -0.03% | 0.12% | 0.33% | -0.69% | -0.33% | 0.08% | |
| NZD | 0.29% | 0.27% | 0.44% | 0.63% | -0.35% | 0.30% | 0.38% | |
| CHF | -0.12% | -0.14% | 0.03% | 0.23% | -0.76% | -0.11% | -0.42% |
The heat map shows percentage changes of major currencies against each other. The base currency is picked from the left column, while the quote currency is picked from the top row. For example, if you pick the Euro from the left column and move along the horizontal line to the Japanese Yen, the percentage change displayed in the box will represent EUR (base)/JPY (quote).
In the European morning on Wednesday, US stock index futures trade in negative territory and the 10-year US yield clings to small daily gains at around 4.85%, helping the USD hold its ground.
In the second half of the day, September New Home Sales data from the US will be looked upon for fresh impetus. Several Federal Reserve policymakers voiced concerns over the negative impact of high interest rates on the housing market conditions. Hence, a noticeable decline in this data could hurt the USD with the immediate reaction.
On Thursday, the US Bureau of Economic Analysis will release the first estimate of the third-quarter Gross Domestic Product (GDP) growth.
GBP/USD Technical Analysis
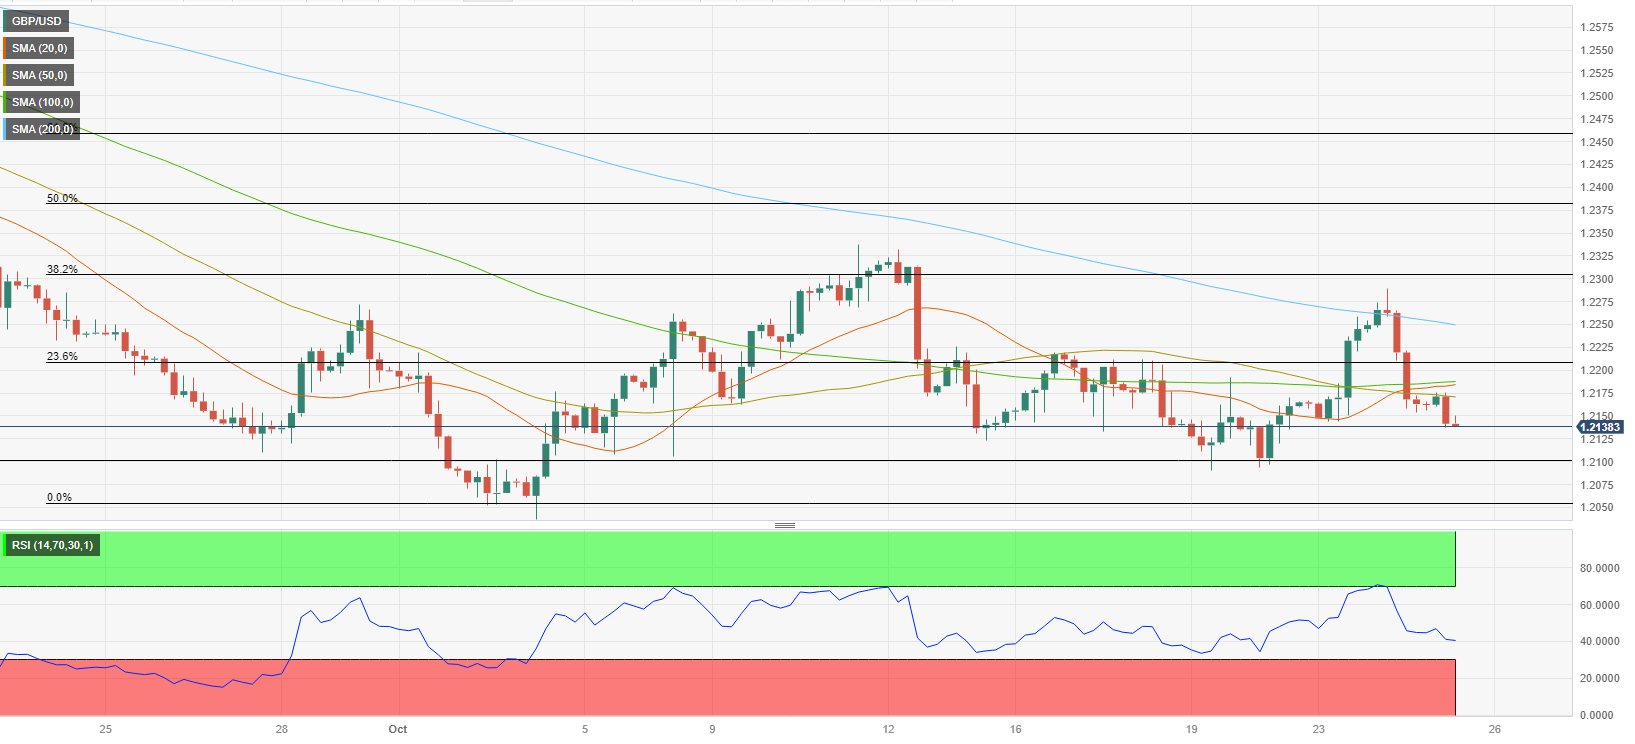
The Relative Strength Index (RSI) indicator on the 4-hour chart declined below 50 and the last 4 4-hour candles closed below the 100-period and the 50-period Simple Moving Averages (SMA), reflecting the bearish bias.
On the downside, 1.2100 (static level, psychological level) aligns as key support. If buyers fail to defend that level, additional losses toward 1.2050 (end-point of the latest downtrend) could be witnessed.
GBP/USD needs to clear 1.2190-1.2200 resistance, where the 100-period SMA and the Fibonacci 23.6% retracement meet, to attract technical buyers. In this scenario, 1.2250 (200-period SMA) and 1.2300 (Fibonacci 38.2% retracement) could be seen as next resistances.
Author

Eren Sengezer
FXStreet
As an economist at heart, Eren Sengezer specializes in the assessment of the short-term and long-term impacts of macroeconomic data, central bank policies and political developments on financial assets.