|

GBP/AUD surges over 700 pips after Elliott Wave forecast identified a bullish turn

The GBPAUD charts provide an excellent example of how Elliott Wave analysis can help identify potential market turning points and prepare for significant directional moves.

Our 10.28.2026 analysis anticipated that GBPAUD was approaching the final stages of a corrective decline in wave X. Rather than chasing the market lower, we were looking for the correction to complete before anticipating a bullish reversal.

The forecast: Identifying the final corrective decline

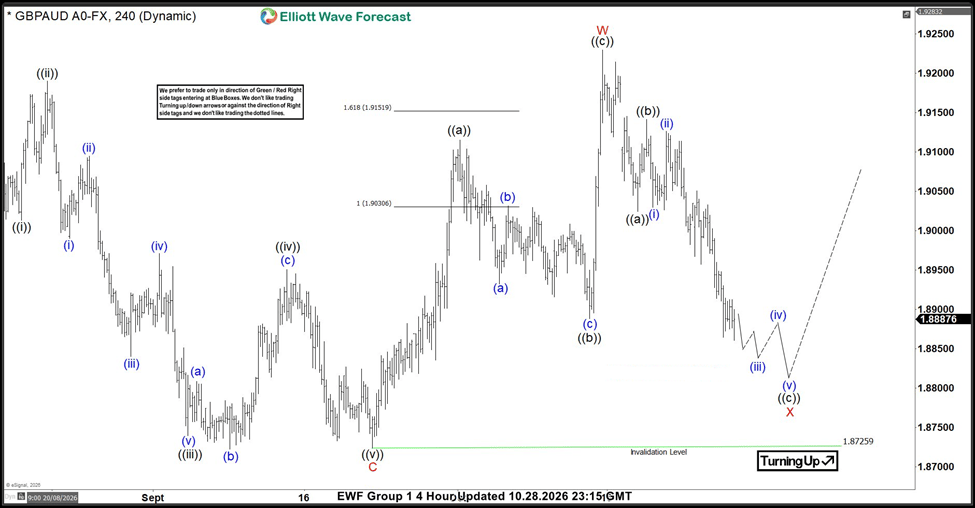
In our original 4-hour chart, GBPAUD was developing a larger corrective structure following its previous advance to approximately 1.9250.
Chart

Our preferred Elliott Wave count suggested that the rally had completed wave W, followed by a corrective decline in wave X.

At the time of the forecast, price was expected to continue lower through a five-wave sequence labelled waves (i), (ii), (iii), (iv), and (v), completing wave ((c)) of X.

We projected that this final decline could reach the 1.8780–1.8800 region before the market established a low and turned higher.

The chart also identified an important invalidation level at 1.87259. As long as this level held, our preferred bullish outlook following the completion of wave X remained valid.

What happened next?

The subsequent price action unfolded in line with the broader directional expectation outlined in our 10.28.2026 analysis.

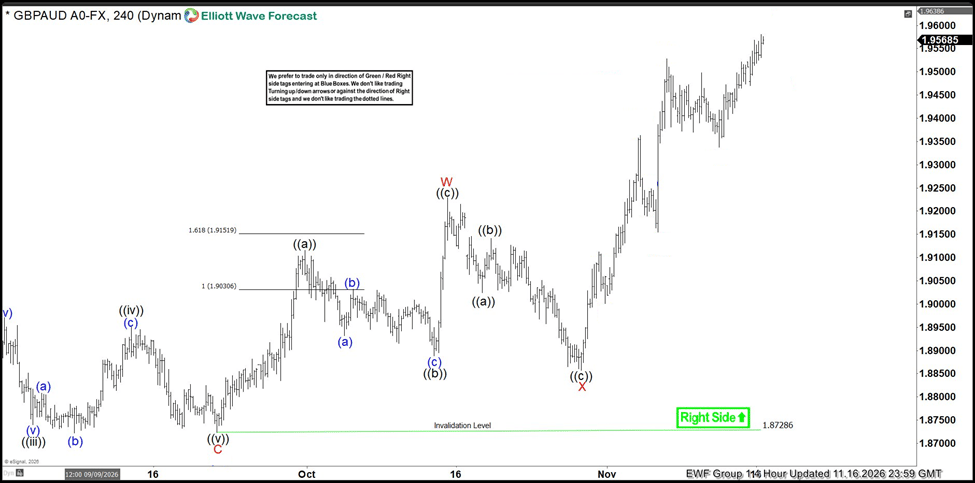
GBPAUD continued lower and established a corrective low around the 1.8850 region, remaining above our invalidation level at 1.87259.

Note: Certain labels have been intentionally concealed to protect the exclusivity of our members.
Chart

From that low, the pair reversed sharply higher, developing a strong bullish sequence.

The November 16 chart shows the recovery unfolding through a series of impulsive and corrective swings, with price advancing through the 1.9000, 1.9200, and 1.9400 levels before reaching approximately 1.9600.

This marked a significant shift in market direction, with the corrective decline giving way to a strong bullish advance and has rallied over 700 pips.

Author

Elliott Wave Forecast Team

Elliott Wave Forecast Team

ElliottWave-Forecast.com

More from Elliott Wave Forecast Team
Share:

Editor's Picks

AUD/USD remains depressed below 0.6750 after RBA minutes

AUD/USD treads water below 0.6750 in Asia on Tuesday, struggling near ten-month lows. The pair fails to find any inspiration from RBA Governor Bullock’s hawkish remarks. Moreover, Minutes from the November RBA meeting also had little impact on the Australian Dollar amid a bullish US Dollar undertone, bolstered by firming Fed hike bets and geopolitical uncertainties.

USD/JPY holds steady around 156.50 as 'Yentervention' risks loom

USD/JPY is consolidating around mid-156.00s in the Asian session on Tuesday as traders stay on high alert amid speculation that authorities will step in to support the Japanese Yen. Meanwhile, the US Dollar holds its recent gains at a 19-month high, amid firming Fed rate-hike bets and geopolitical uncertainty. This, along with the wide US-Japan rate differential, acts as a tailwind for the pair.


Gold trims intraday recovery gains as Fed hike bets and Iran risks support USD

Gold struggles to capitalize on modest recovery gains and trades near the lowest level since October 2025, set the previous day, albeit retaining a mildly positive tone through the first half of the European session. The US Dollar pauses following the recent strong rally to a 19-month peak, offering some support to the commodity. However, firming US Federal Reserve rate-hike bets and geopolitical uncertainties limit USD losses, capping the non-yielding bullion.

Pi Network sinks to record low of $0.0551 as bears dominate

Pi Network extends its losing streak, hitting a new all-time low of $0.0551 on Tuesday as bearish pressure intensifies. Weakening derivatives metrics suggest bears remain in control. In addition, deteriorating technical indicators point to elevated downside risk, despite oversold conditions that could trigger a short-term relief bounce.

Make or break tonight: Nvidia reports Q3 earnings
The Nasdaq lost 2.5% yesterday following an interim final rule by the US Commerce Department on US export restrictions on AI chips (to China). The rule targets a loophole where Chinese firms rent computing power from data centers in unrestricted countries. Data center operators in Singapore, Malaysia, Thailand, Indonesia and Brazil must now request a US license to buy advanced AI chips.
Gold isn't being sold for thew reason most people think
Gold (XAU/USD) remains under heavy selling pressure on Monday, hitting its lowest level in 13 months. The precious metal is struggling to recover despite escalating geopolitical tensions in the Middle East, a backdrop that would normally encourage investors to seek protection in safe-haven assets. However, the main driver behind Gold's decline is not the geopolitical uncertainty itself.