- USD/JPY bounces to around 115.50 after defending 115.00.
- Russia-Ukraine geopolitical risks continue to remain a threat.
- Downside appears cushioned amid a bunch of healthy support levels.
USD/JPY is consolidating Friday’s sell-off around mid-115.00s, trying to find the conviction to extend the recovery momentum.
Even though the risk sentiment has somewhat recovered, worries over a potential Russia-Ukraine war persist, which keeps any renewed upside in the US Treasury yields limited. This, in turn, could stem USD/JPY’s rebound.
Bulls may also find comfort from an increasing case for rising global rates, as inflation soar worldwide. The January Fed meeting’s minutes are likely to ramp up expectations for aggressive tightening by the world’s most powerful central bank.
Meanwhile, the Bank of Japan (BOJ) successfully defended its key bond yield target on Monday, as attention turns towards the Japanese growth numbers due on Tuesday.
In the meantime, the speech from St. Louis President James Bullard will be closely eyed for fresh hints on the Fed’s rate hike plans.
USD/JPY: Technical outlook
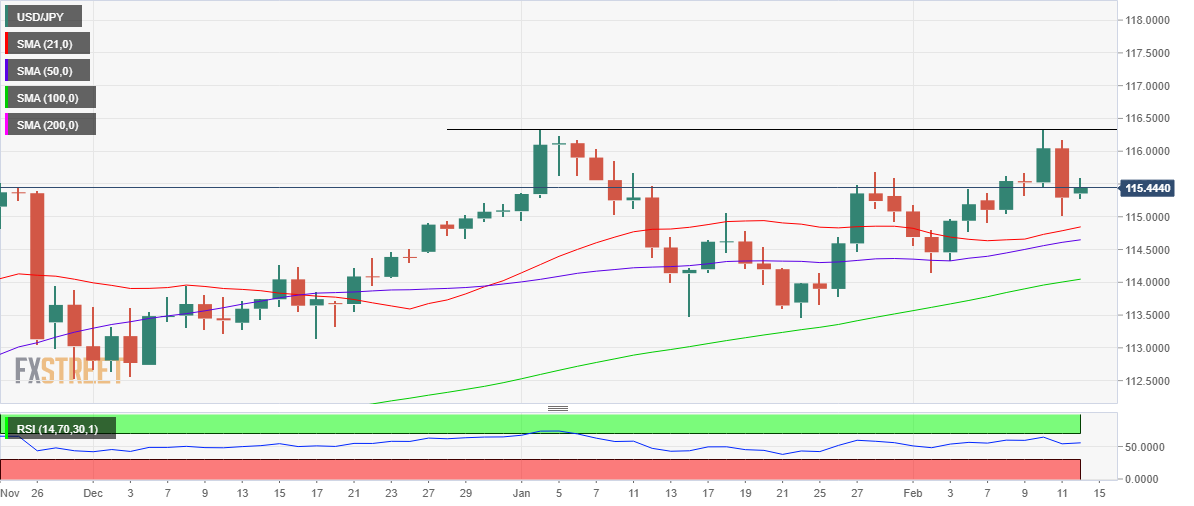
USD/JPY’s daily chart shows that the price found buyers well above the bullish 21-Daily Moving Average (DMA) at 114.79.
Also, bulls remain hopeful as the spot managed to defend the 115.00 level, as the 14-day Relative Strength Index (RSI) continues to hold above the midline.
On the upside, daily closing above 116.00 is needed to retest Friday’s high of 116.17, above which the critical horizontal trendline resistance at 116.34 will come into play.
USD/JPY: Daily chart
USD/JPY: Additional levels to consider
Information on these pages contains forward-looking statements that involve risks and uncertainties. Markets and instruments profiled on this page are for informational purposes only and should not in any way come across as a recommendation to buy or sell in these assets. You should do your own thorough research before making any investment decisions. FXStreet does not in any way guarantee that this information is free from mistakes, errors, or material misstatements. It also does not guarantee that this information is of a timely nature. Investing in Open Markets involves a great deal of risk, including the loss of all or a portion of your investment, as well as emotional distress. All risks, losses and costs associated with investing, including total loss of principal, are your responsibility. The views and opinions expressed in this article are those of the authors and do not necessarily reflect the official policy or position of FXStreet nor its advertisers. The author will not be held responsible for information that is found at the end of links posted on this page.
If not otherwise explicitly mentioned in the body of the article, at the time of writing, the author has no position in any stock mentioned in this article and no business relationship with any company mentioned. The author has not received compensation for writing this article, other than from FXStreet.
FXStreet and the author do not provide personalized recommendations. The author makes no representations as to the accuracy, completeness, or suitability of this information. FXStreet and the author will not be liable for any errors, omissions or any losses, injuries or damages arising from this information and its display or use. Errors and omissions excepted.
The author and FXStreet are not registered investment advisors and nothing in this article is intended to be investment advice.
Recommended content
Editors’ Picks
AUD/USD remained bid above 0.6500

AUD/USD extended further its bullish performance, advancing for the fourth session in a row on Thursday, although a sustainable breakout of the key 200-day SMA at 0.6526 still remain elusive.
EUR/USD faces a minor resistance near at 1.0750

EUR/USD quickly left behind Wednesday’s small downtick and resumed its uptrend north of 1.0700 the figure, always on the back of the persistent sell-off in the US Dollar ahead of key PCE data on Friday.
Gold holds around $2,330 after dismal US data

Gold fell below $2,320 in the early American session as US yields shot higher after the data showed a significant increase in the US GDP price deflator in Q1. With safe-haven flows dominating the markets, however, XAU/USD reversed its direction and rose above $2,340.
Bitcoin price continues to get rejected from $65K resistance as SEC delays decision on spot BTC ETF options

Bitcoin (BTC) price has markets in disarray, provoking a broader market crash as it slumped to the $62,000 range on Thursday. Meanwhile, reverberations from spot BTC exchange-traded funds (ETFs) continue to influence the market.
US economy: slower growth with stronger inflation

The dollar strengthened, and stocks fell after statistical data from the US. The focus was on the preliminary estimate of GDP for the first quarter. Annualised quarterly growth came in at just 1.6%, down from the 2.5% and 3.4% previously forecast.