The US Dollar Index has no dovish tail to price
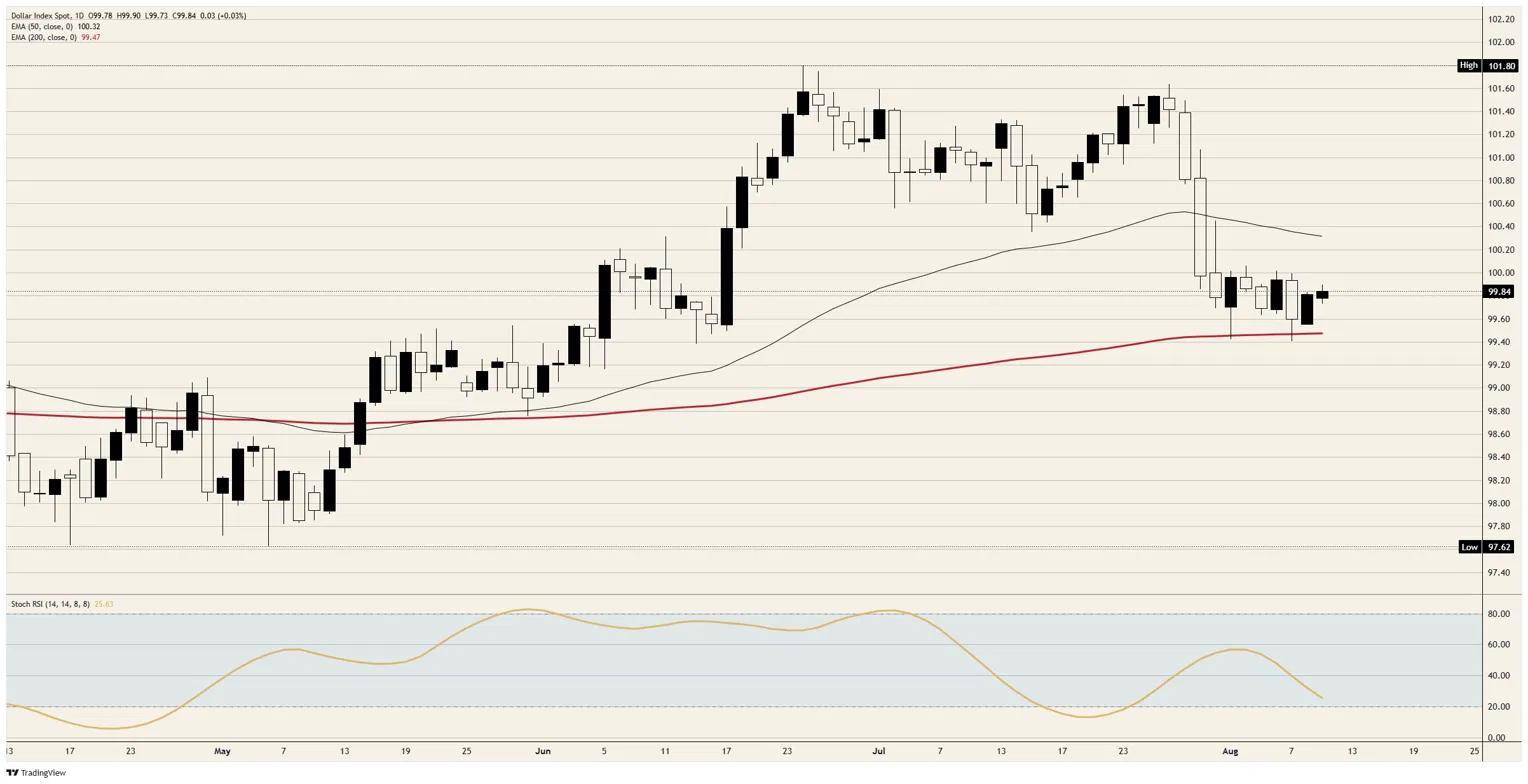
- DXY trades near 99.80, a seventh session holding the 200-day EMA near 99.50.
- Futures price no Fed cut at any meeting through July 2027.
- Consensus has core PPI at 4.2% YoY against core CPI at 2.5%.


Tuesday gives the Dollar Index a session with almost nothing in it. The index trades near 99.80 inside a range of under two tenths of a point, the tightest bar of a coil that has held between the 200-day Exponential Moving Average (EMA) near 99.50 and the 100.00 handle since the final days of July. Two releases have landed and neither carried a message, with the four-week average of private hiring slowing to 8.25K from 11K and existing home sales down 1.7% MoM.
A coin flip with only one way to break
Futures put the September 16 meeting at 50.1% for a hold against 49.9% for a quarter point, the flattest reading of the year and a second consecutive session at a dead heat. Nothing on Tuesday's tape will move that. The shape of the distribution behind the front meeting matters considerably more than the front meeting itself.
The column that would price a cut reads 0.0% at eight straight Federal Open Market Committee (FOMC) meetings, from September out to July 2027, and first prints anything worth naming at 0.5% in September 2027. Over the same run the modal outcome climbs a quarter point higher by the spring. A soft Consumer Price Index (CPI) print on Wednesday can postpone a hike, but it cannot buy the Dollar a cut, because there is no cut in the curve to buy.
The wedge the producer data has to close
Consensus has July CPI at 3.4% YoY from 3.5% and core at 2.5% from 2.6%, which is the disinflation headline the tape will trade at 12:30 GMT on Wednesday. Thursday's Producer Price Index (PPI) consensus tells a different story at the same hour: 4.9% YoY on the headline and 4.2% on core, running roughly a point and a half above the consumer measure for the same month.
That gap is where the war premium and the tariff pipeline are sitting, and the second-quarter productivity accounts identify who has been absorbing it. Unit labour costs ran 1.3% annualised against a value-added output deflator at 7.0%, with the labour share at its lowest reading since the series opened in 1947. Margin has taken the hit so far, and producer prices are the series that reports whether it still can.
Two regional Fed presidents speak on Thursday, one at 12:15 GMT and one at 12:40, bracketing the release. The earlier of them dissented in July for a quarter point and argued on Monday that more than one increase may be needed, and that a 3.50% to 3.75% range is not meaningfully restricting anything. A hot producer print landing between those two appearances is the cleanest hawkish setup on the week.
The war stopped paying the Dollar
Tehran has made compensation for war damage a condition of reopening the Strait of Hormuz, and Washington has answered with a compensation demand of its own. That is not a negotiation so much as two invoices, and Tuesday's coverage has the administration falling back on sanctions as the other routes stall.
The news has not changed nearly as much as the response to it. Escalation headlines that bid the Dollar as a haven in June now bid Crude Oil and the currencies that sell it instead. The index sits at levels last seen in early June with the conflict hardening rather than easing, which inverts the June relationship outright. The war reaches the Dollar through the inflation pipeline now, and that route runs through Thursday rather than through the tape.
Wednesday evening carries the other number
The monthly budget statement lands at 18:00 GMT on Wednesday, roughly six hours after CPI, with consensus at a deficit near 346 billion Dollars against 120 billion the month before. Tariff refunds have been running through customs receipts all summer, and the fiscal year is tracking well above the estimates carried into it.
Thursday also brings initial claims at 202K consensus from 199K. Friday delivers retail sales at 0.1% MoM from 0.2% and preliminary August Michigan sentiment at 54.5 from 55.2, with the one-year and five-year inflation expectation series carrying 4.2% and 3.3% priors and no consensus attached. A week that opens on a coin flip is unlikely to leave one standing.
Levels
Resistance: The 100.00 handle has capped every attempt since the final day of July and is the line that matters this week. Above it the declining 50-day EMA near 100.25 is the first real test, with the late-July peak just above 101.50 the level a hawkish week would aim at.
Support: The 200-day EMA near 99.50 has held four separate tests inside eight sessions, with the twin session lows sitting just beneath it in the 99.45 area. Losing that band opens the 99.00 handle and then the 98.50 area, where the index last based in May.
Bias: Bullish while the 99.50 band holds. The daily Stochastic Relative Strength Index (Stoch RSI) near 25 is rolling into oversold on equal lows rather than lower ones, and the week's repricing risk points one way, since a hawkish surprise has room to run while a dovish one has no cut to price into. Objectives are 100.00 and then the 50-day EMA near 100.25, with invalidation on a daily close beneath the 99.45 area, which would put the 99.00 handle in play quickly.
DXY daily chart
US Dollar FAQs
The US Dollar (USD) is the official currency of the United States of America, and the ‘de facto’ currency of a significant number of other countries where it is found in circulation alongside local notes. It is the most heavily traded currency in the world, accounting for over 88% of all global foreign exchange turnover, or an average of $6.6 trillion in transactions per day, according to data from 2022. Following the second world war, the USD took over from the British Pound as the world’s reserve currency. For most of its history, the US Dollar was backed by Gold, until the Bretton Woods Agreement in 1971 when the Gold Standard went away.
The most important single factor impacting on the value of the US Dollar is monetary policy, which is shaped by the Federal Reserve (Fed). The Fed has two mandates: to achieve price stability (control inflation) and foster full employment. Its primary tool to achieve these two goals is by adjusting interest rates. When prices are rising too quickly and inflation is above the Fed’s 2% target, the Fed will raise rates, which helps the USD value. When inflation falls below 2% or the Unemployment Rate is too high, the Fed may lower interest rates, which weighs on the Greenback.
In extreme situations, the Federal Reserve can also print more Dollars and enact quantitative easing (QE). QE is the process by which the Fed substantially increases the flow of credit in a stuck financial system. It is a non-standard policy measure used when credit has dried up because banks will not lend to each other (out of the fear of counterparty default). It is a last resort when simply lowering interest rates is unlikely to achieve the necessary result. It was the Fed’s weapon of choice to combat the credit crunch that occurred during the Great Financial Crisis in 2008. It involves the Fed printing more Dollars and using them to buy US government bonds predominantly from financial institutions. QE usually leads to a weaker US Dollar.
Quantitative tightening (QT) is the reverse process whereby the Federal Reserve stops buying bonds from financial institutions and does not reinvest the principal from the bonds it holds maturing in new purchases. It is usually positive for the US Dollar.
Author
Joshua Gibson
FXStreet
Joshua joins the FXStreet team as an Economics and Finance double major from Vancouver Island University with twelve years' experience as an independent trader focusing on technical analysis.